
This is the fifth part of the talent distribution series. You can find the parts here: Percentiles, Predictability, Forwards vs. Defenders and goaltending.
In this post I will focus mainly on contracts and contract value.
The data set
All contract data for this article is from capfriendly.com, and the data goes back to the 2013-2014 season. You can download all the caphits here. I’m missing contract information for quite a few players in the 2013-2014 season, which is why I didn’t go further back.
The salary cap has gone from 64.3M in 2013-2014 to 81.5M in 2020-2021, so it’s not really relevant to compare caphits directly. Instead, I’m using Cap% to compare contracts.
Contract distributions
We can start off by looking at contract distributions. I’ve excluded all entry level contracts (ELCs), since those are predefined by the CBA.
Here’s the contract distributions, when we set the minimum requirement to 500 minutes of ice time.
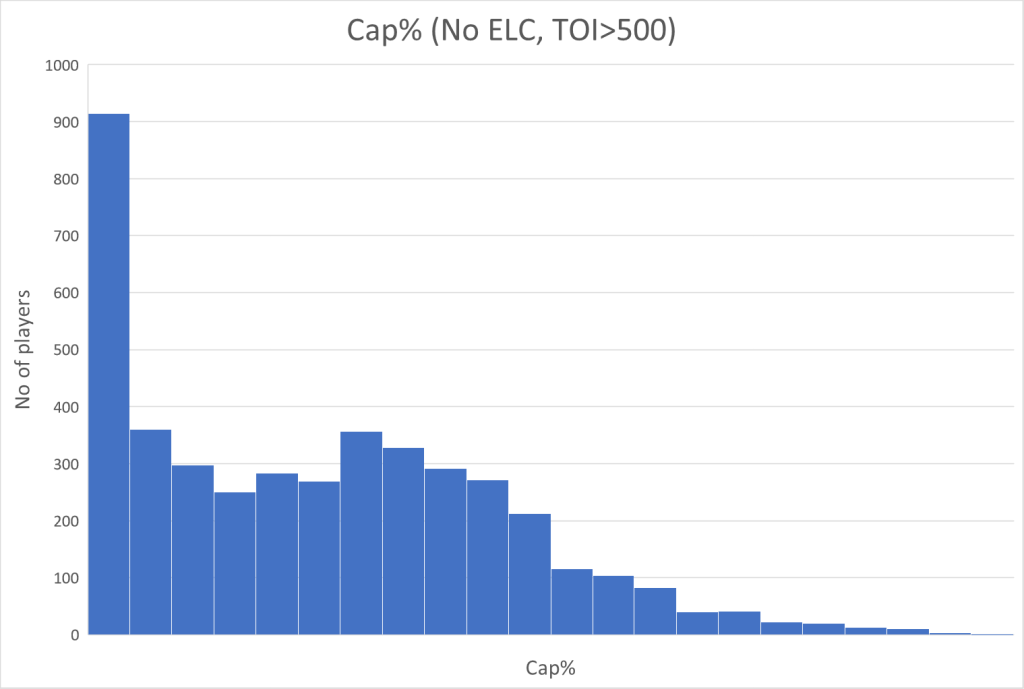
Unsurprisingly, we see a lot of league minimum caphits (or close to league minimum), and if we included ELCs we would see a lot more. I think this is a pretty typical wage distribution you see in many businesses. However, it doesn’t fit the talent distribution we found in part 1 of this article series.
Here’s the talent (sGAA_60) distribution of the same players:
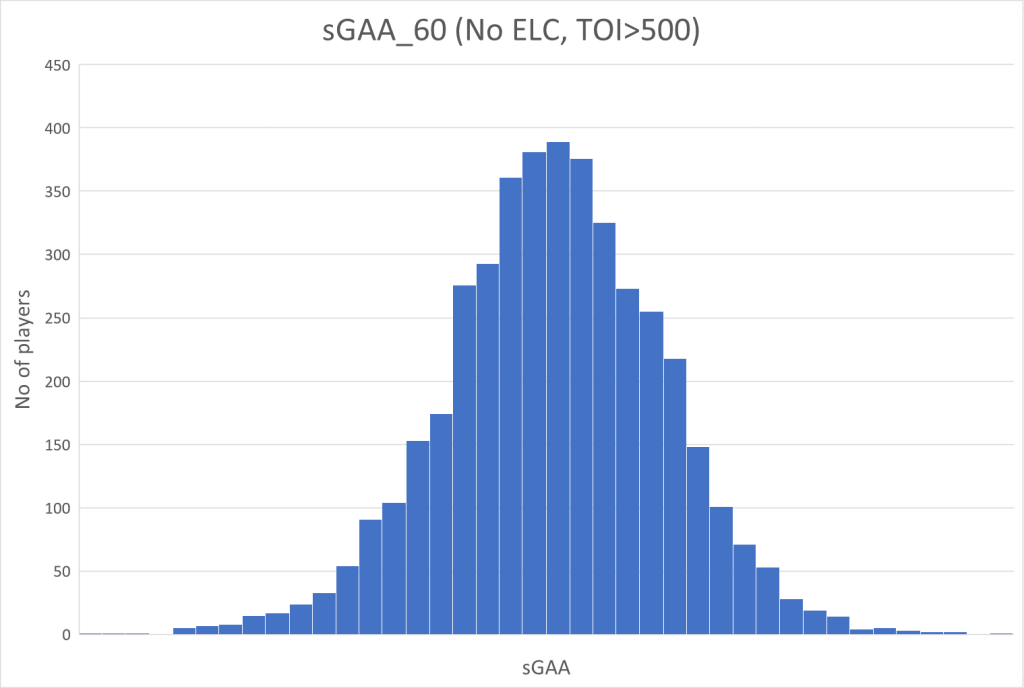
Based on this alone, we shouldn’t expect a great correlation between caphit and on ice performance.
Contract value
Next, we want to look at the contract value by comparing caphit to performance.
Here’s the correlation between single season Cap% and sGAA_60 (performance):
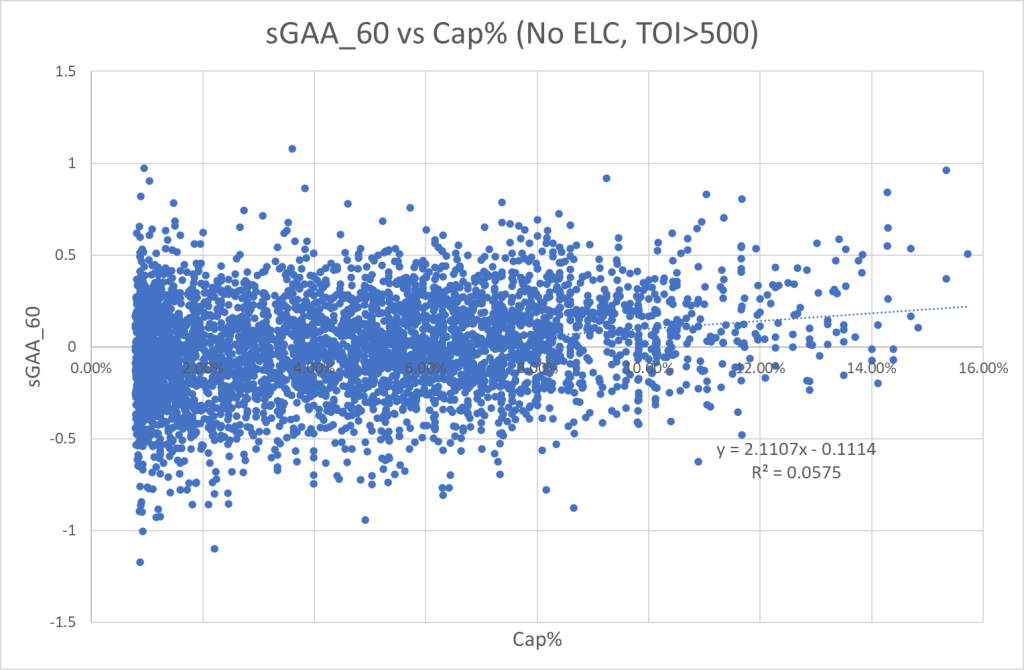
We do see some correlation, but it’s probably not as great as you would’ve hoped. If I increased the sample size to 3 years, I think there would be a slightly better correlation. There’s a lot variance, when you look at single season data (especially for goaltenders).
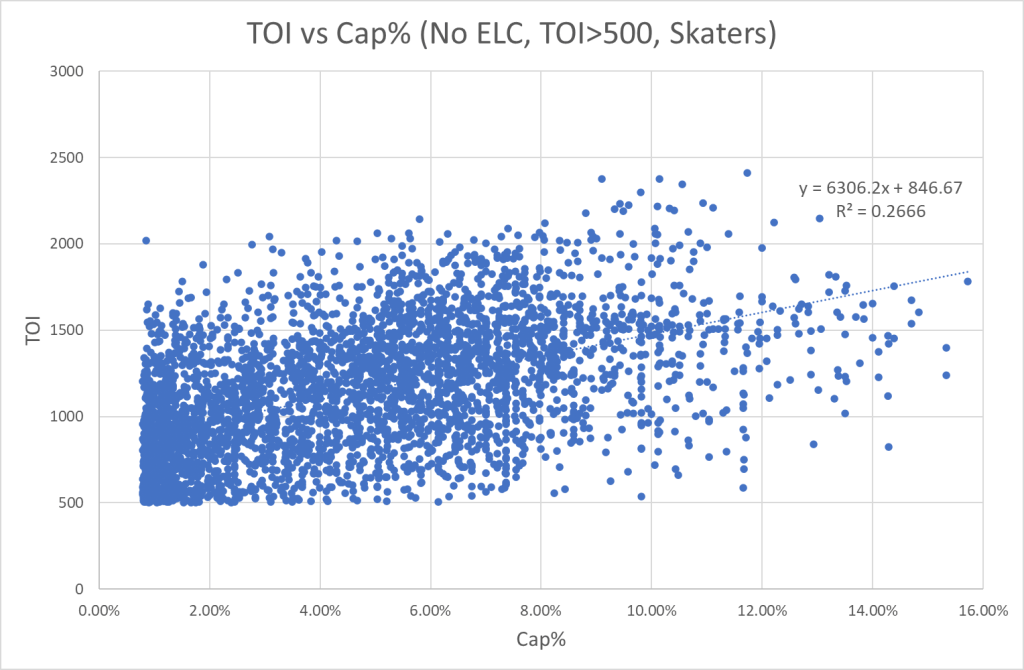
I also looked at the correlation between ice time and caphit, and here we see a much greater correlation. So, players may not perform like their caphit suggest, but their ice time will most likely match their caphit.
Positions
Up until now, I’ve looked at all players together, but what happens when we look at contract value for each position – forward, defender and goaltender.
Here’s the correlation between Cap% and sGAA_60 for forwards, defenders and goaltenders respectively:

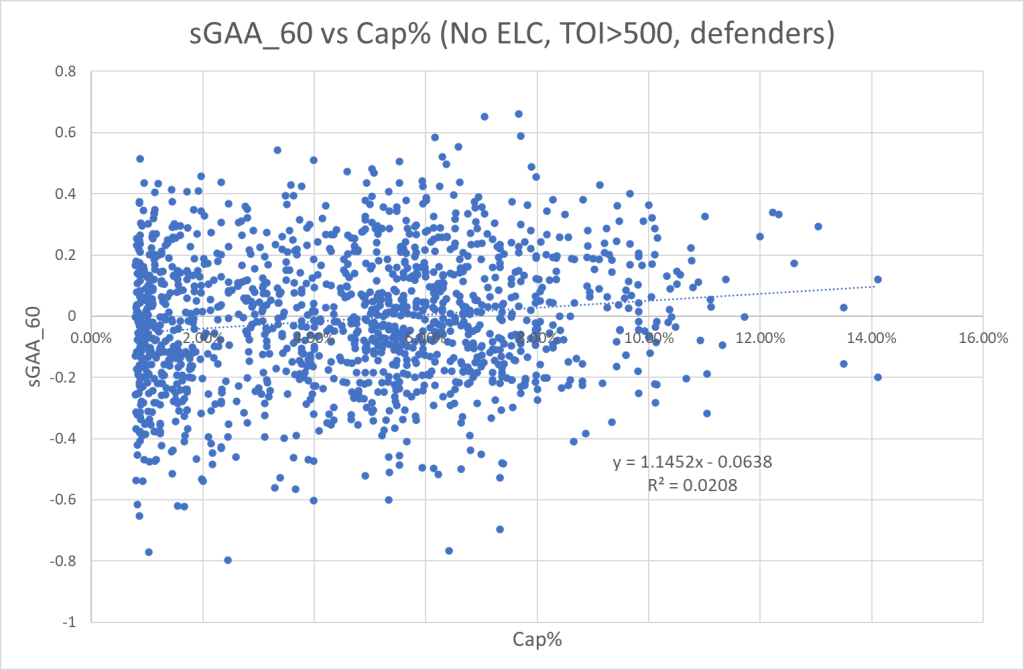
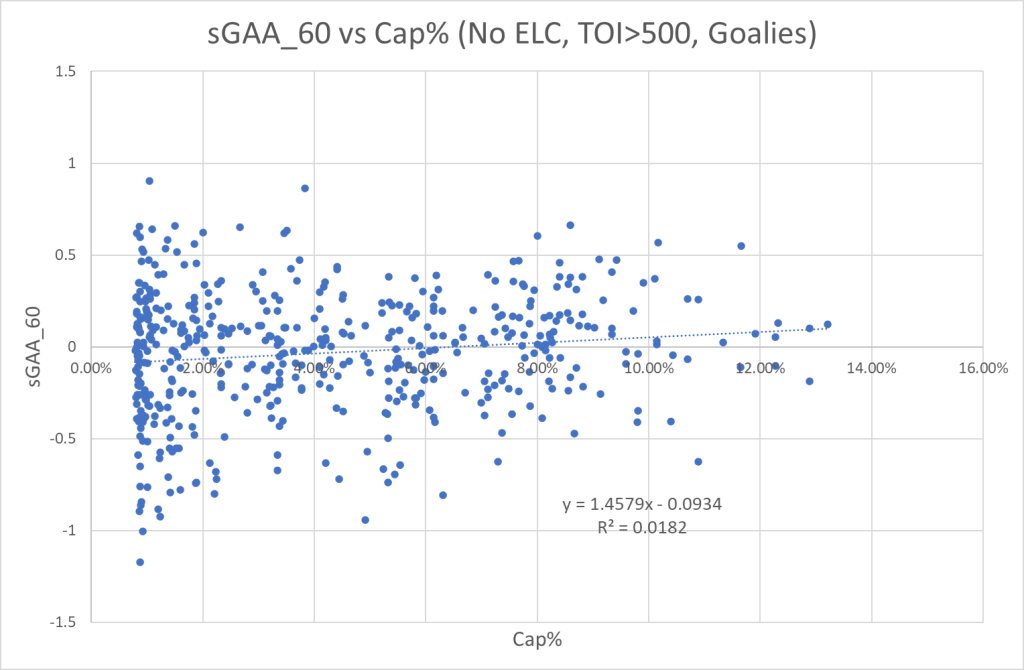
It should be mentioned that 500 minutes of ice time is a relatively small sample size (especially for goaltenders), but I still think the general conclusions hold.
For forwards we see a decent correlation between caphit and performance, which indicates that forwards are being paid based on actual impact. For defenders and goaltenders there’s a disturbingly small correlation between caphit and performance. Either my model is bad at evaluating defenders and goaltenders or GMs are bad evaluators of defenders and goaltenders.
It is interesting that we see this mismatch between model evaluations and GM/coach evaluations. It’s tempting to say that GMs are stupid and hockey analytics is perfect, but that’s likely not true. I do think “hockey” people overvalue certain player traits, but at the same time you should be very careful not to put too much weight on player models. It’s nearly impossible to truly isolate performances, when there’s so many skaters on the ice at the same time.
Contract type
I would also like to look at the different contract types. Here’s the correlation between Cap% and performance for RFA contracts and UFA contracts respectively.

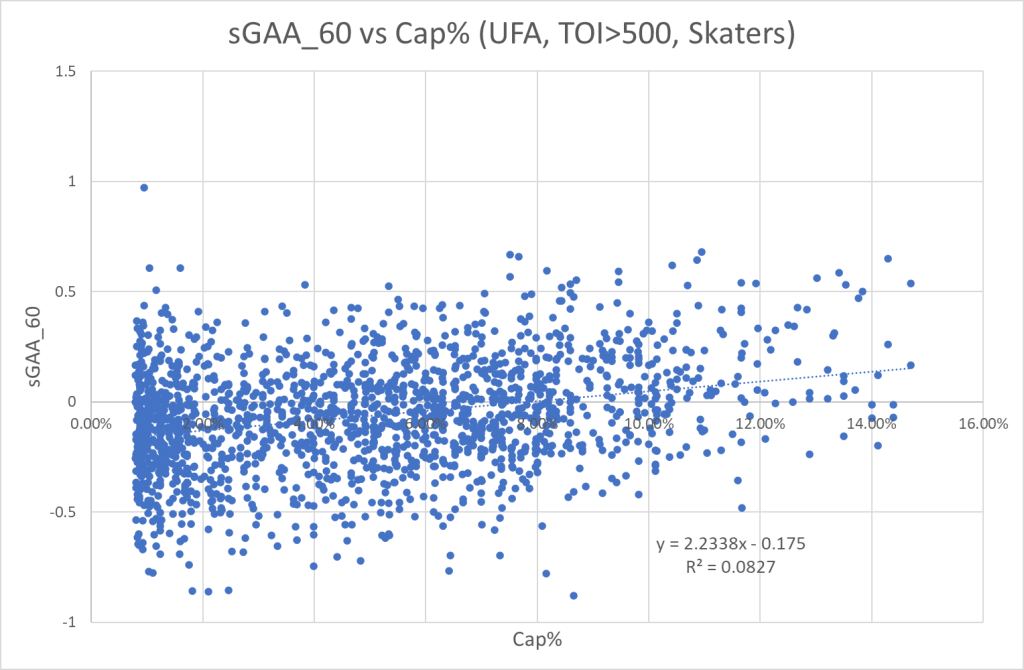
We see a similar correlation in the two graphs, but we also see that RFA players generally perform at a higher level (the trendline is higher in the graph). This indicates that RFA contracts are more valuable than UFA contracts. I think that’s fairly common knowledge though.
To illustrate this difference, I’ve put together the following table of sGAA_60:
| sGAA_60 | RFA | UFA | ELC |
|---|---|---|---|
| Forwards | 0.0451 | -0.0586 | 0.0113 |
| Defenders | 0.0390 | -0.0458 | 0.0013 |
| Goaltenders | 0.0424 | -0.0338 | 0.0016 |
| All | 0.0426 | -0.0491 | 0.0072 |
There are a few things to notice here. RFA players perform well above average and UFA players well below average. This makes perfect sense when you consider age curves. The other interesting thing to note, is that ELC forwards perform above average, whereas ELC defenders and goaltenders perform around average. This could be an indication that forwards are quicker to develop.
I’ve also looked at Cap% for each position and contract type. I can’t just sum the Cap% of all players, because some players only played a few games in the NHL, and the rest of the time their Caphit was buried in the minors. So, I’ve used Cap% multiplied by games played instead. This underestimates the Cap% spend on goaltenders though, because the Caphit of the backup isn’t included unless he plays. It’s just something to be aware of.
| Cap% | RFA | UFA | ELC |
|---|---|---|---|
| Forwards | 29.2% | 28.7% | 3.4% |
| Defenders | 15.3% | 15.2% | 1.6% |
| Goaltenders | 2.6% | 3.9% | 0.1% |
| All | 47.2% | 47.7% | 5.1% |
The spending on RFA players is pretty much the same as the spending on UFA players, but we see a trend towards paying RFAs more and UFAs less:
| Cap% | RFA | UFA | ELC |
|---|---|---|---|
| 13-14 | 44.9% | 49.7% | 5.4% |
| 14-15 | 42.8% | 52.6% | 4.7% |
| 15-16 | 44.1% | 50.7% | 5.3% |
| 16-17 | 45.2% | 49.5% | 5.3% |
| 17-18 | 49.3% | 45.1% | 5.7% |
| 18-19 | 51.7% | 42.8% | 5.5% |
| 19-20 | 50.7% | 44.9% | 4.4% |
| 20-21 | 50.3% | 45.4% | 4.3% |
Summary
- There’s a clear difference between talent distribution and contract distribution. Most contracts are close to league minimum.
- For forwards there’s a pretty good correlation between caphit and performance.
- For defenders and goaltenders there’s a bad correlation between caphit and performance, so there’s a mismatch between the model evaluation and GM evaluation for defenders and goaltenders. Increased variance could also be part of the explanation. It would be interesting to increase the sample size from one year to three years.
- RFAs play at a level well above average, whereas UFAs play at a level well below average. This is due to age decline.
- For ELC players the performance is close to average for defenders and goaltenders, but above average for forwards.
- RFA contracts generally hold more value than UFA contracts.
- Looking at all the seasons, RFA spending is similar to UFA spending, but lately teams spend more money on RFA contracts.
Data from Evolving-Hockey.com and Capfriendly.com
