
In this piece of the talent distribution series, I will compare forwards and defenders. I recommend reading Part 1 and perhaps Part 2 first.
How the sGAA model is designed
Before we get started it’s important to understand how my sGAA model is calibrated. It’s designed to describe goal differential at the team level. So, if a player is worth 5 goals in the sGAA model, he basically adds 5 goals to overall team goal differential. Obviously, it’s not an exact model, but that’s the premise.
This means that the baselevel is average rather than replacement level. Also, it’s built as a zero-sum model, so the total sGAA of all forwards or defenders will always add up to zero. In fact, the zero-sums are based on three parameters: Position, season and component (e.g., EVO or EVD). You can find examples of the calculations in Appendix 1.
As an example: In season 2014-2015 the sum of EVO (even strength offense) amongst all forwards were zero.
How to interpret sGAA
Because the model is calibrated the way it is, we always compare players to league average based on these parameters: Position, season and component. So, it’s very easy to interpret. If a defender had a positive EVD value, it simply means he was above average in even strength defense compared to other defenders in that same time frame.
However, we can’t directly compare forwards to defenders. At least not, to answer the question: Are forwards better than defenders? If forwards actually are better than defenders, then the average forward will also be better, so you won’t see it directly in the sGAA model.
You can say that, sGAA measures impact and not quality!
Talent distribution of forwards and defenders
Below are the seasonal talent distributions (sGAA_60) of forwards and defenders.
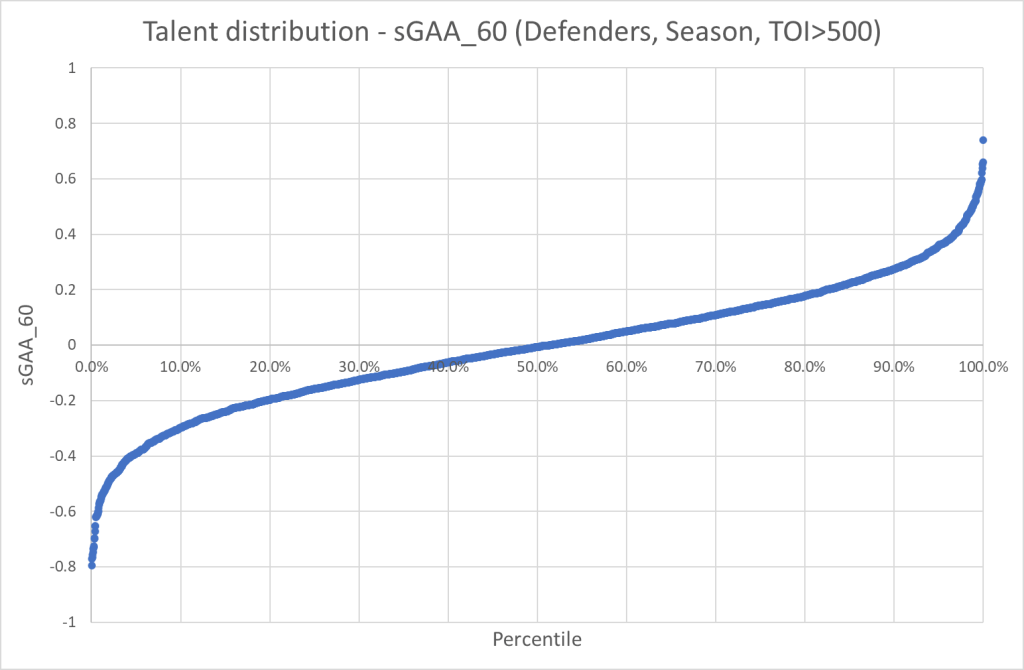


It looks more or less like normal distributions of talent. You could perhaps argue that the forward distribution is skewed slightly to the right, and the defender distribution is skewed slightly to the left. What’s more interesting though, is to look at the scale of the y-axis. Here we see that the spread of the forwards are greater than the spread of the defenders. So, the best forwards are better than the best defenders and the worst forwards are worse than the worst defenders.
We can illustrate this by combining the two graphs:
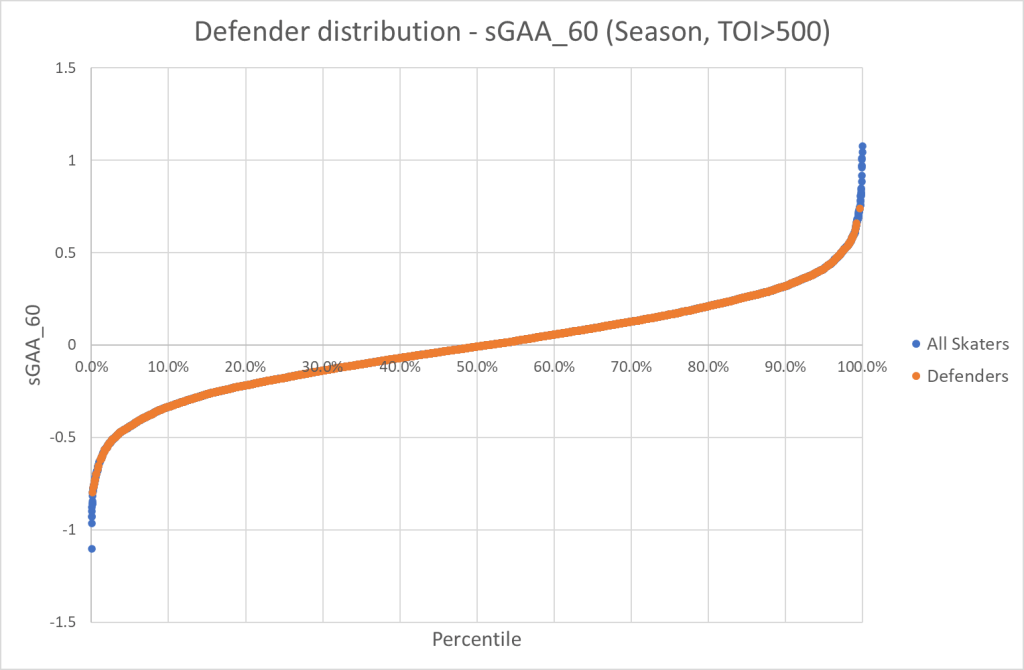
This indicates that forwards have a greater impact per 60 (good or bad) than defenders. But defenders generally play more, so it’s worth looking at impact per game instead. This way we factor in TOI/GP.
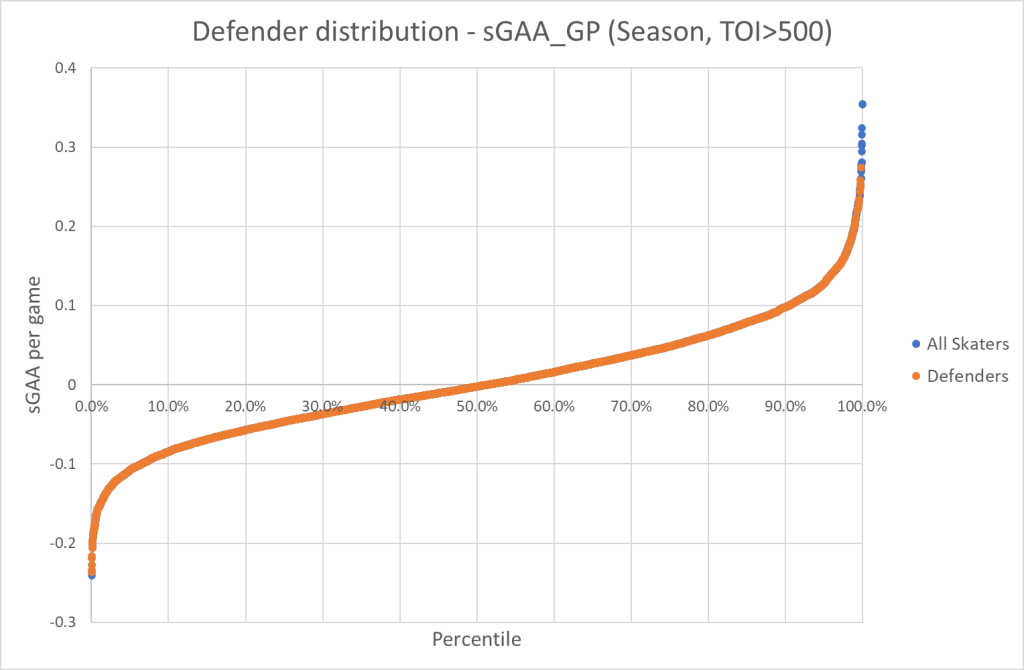
Below are the distributions of sGAA_GP for forwards and defenders:


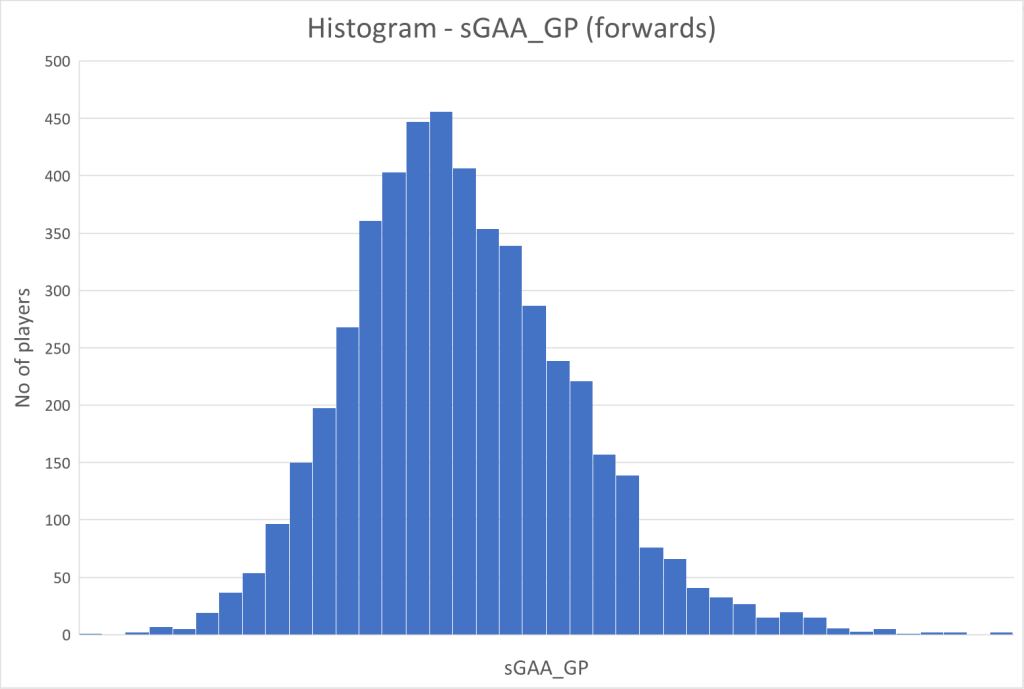
The results here are quite interesting. For the forwards we clearly see the distribution getting skewed towards the better players, which would indicate that ice time is given based on talent (sGAA_60). For defenders this effect is not nearly as pronounced, so the correlation between ice time and talent is not that clear.
If we combine the two graphs, we see that the defender distribution of sGAA_GP (impact per game) now spans from the very worst. This is because the worst forwards get very little ice time, while the worst defenders still get a ton of ice time.
Below are the correlations between ice time and sGAA_60, just to illustrate the difference.

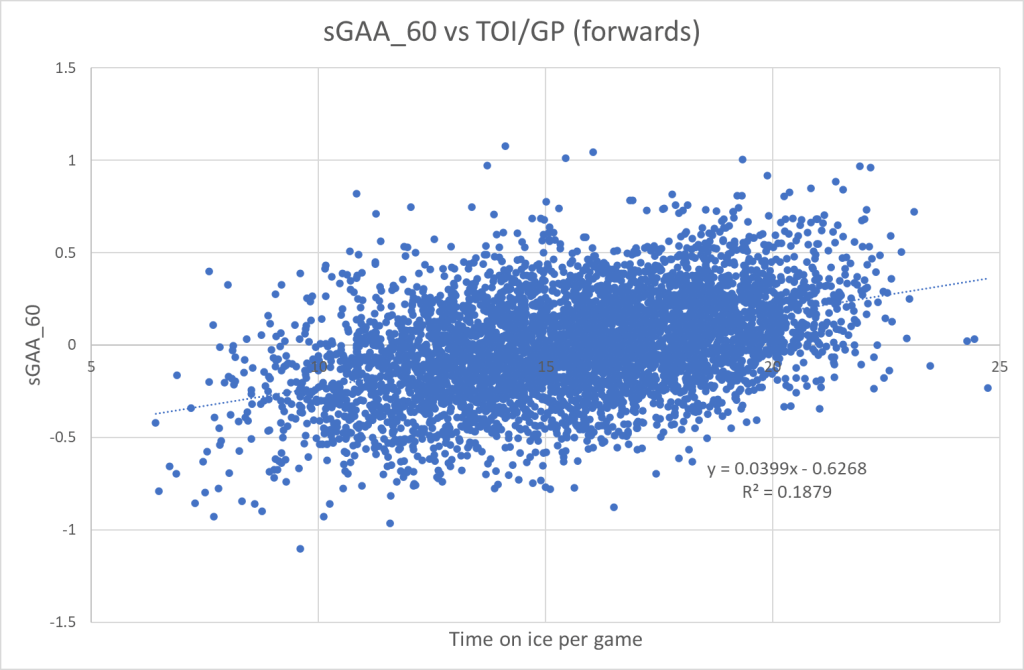
Summary of what we have learned so far:
- sGAA_60 is more or less normal distributed for both forwards and defenders.
- The spread is greater for forwards, so forwards have greater impact per 60 (good or bad)
- For defenders there’s a bad correlation between ice time and sGAA_60. Either coaches/GMs are bad at evaluating defenders or the model have difficulties evaluating defenders… Or it’s a combination of the two. Also, it’s probably easier to “hide” a 4th line forward, than a 3rd pairing defenseman.
- The best forwards still have a greater impact than the best defenders – even when we adjust for TOI/GP.
Impact of each component
Now, I will look at the impact in greater detail, by looking at each component of the model. Before we get to that, it’s worth noting the differences in ice time though. Generally, forwards play a larger percentage of their ice time on the powerplay and a smaller percentage on the penalty kill. This isn’t surprising at all since most teams play with 4F1D on the powerplay… But it’s still worth noting.
| Position | TOI/GP | EV TOI/GP | PP TOI/GP | SH TOI/GP |
|---|---|---|---|---|
| Forwards | 14.93 | 12.16 | 1.59 | 0.90 |
| Defenders | 19.60 | 16.17 | 1.35 | 1.79 |
The model is designed so that the sum of each component will always add up to zero, so we can’t really look total contributions. Instead I’m interested in the spread. How much the average player differs from zero. In other words, I’m interested in the absolute values of each component.
The bigger the absolute value, the bigger the spread and hence the bigger the importance. Here’s the absolute values of each component for forwards and defenders respectively:
| Position | |EVO|_60 | |EVD|_60 | |PPO|_60 | |SHD|_60 | |Take|_60 | |Draw|_60 | |sGAA|_60 |
|---|---|---|---|---|---|---|---|
| Forwards | 0.217 | 0.113 | 0.485 | 0.399 | 0.042 | 0.049 | 0.232 |
| Defenders | 0.147 | 0.108 | 0.457 | 0.348 | 0.039 | 0.026 | 0.181 |
We can start by looking at the last column – the overall sGAA. Here we see that forwards have a greater spread and thereby a larger impact per 60 minutes. This is exactly what this graph showed:

Before we look at the individual components, it’s important to know that the per 60 refers to the ice time in that strength state. So, for the first to columns it’s absolute value per 60 minutes of even strength ice time, whereas the PPO value (powerplay offense) is per 60 minutes of powerplay ice time… and so on.
With that out of the way, we can look at the numbers. For forwards we see that EVO is more important than EVD. This is why forwards who are near the top in offense and near bottom in defense are still really, really good. See Draisaitl:

The opposite is not the case, exemplified here by Riley Nash:

If we go on to compare forwards and defenders, we see that forwards have a greater impact on even strength offense and penalty drawing. I think this is pretty much in line with what we would expect.
Replacement level vs. Average level
Up until now, we have only looked at impact compared to average. Let’s also consider impact compared to replacement level. To do that, I’m using Evolving-Hockey’s GAR model.
We will start by looking at forwards:
| FORWARDS | EVO | EVD | PPO | SHD | Take | Draw | Overall |
|---|---|---|---|---|---|---|---|
| GAR | 17359 | -344 | 4719 | -140 | 2473 | 350 | 24394 |
| GAR_60 | 0.221 | -0.004 | 0.458 | -0.024 | 0.026 | 0.004 | 0.253 |
| GAR_GP | 0.045 | -0.001 | 0.012 | 0.000 | 0.006 | 0.001 | 0.063 |
There’re a few things to notice right away. First of all, the majority of GAR stems from even strength offense. Secondly, the even strength defense is negative. This means that a replacement level forward is “better” than average defensively. This doesn’t seem right, but if you view offense vs. defense in terms of risk vs. reward you can come up with a probable explanation.
If you play a high-risk/high-reward kind of game, it will almost certainly increase your offense at the expense of defense. Again, Draisaitl or McDavid are good examples of this. On the other hand if you play a low risk game, it may help your defensive stats, but it will almost certainly come at the expense of offensive output.
I think most replacement level forwards are told to play a low-risk style, which explains why replacement level defense is above average.
Here’s the defenders:
| DEFENDERS | EVO | EVD | PPO | SHD | Take | Draw | Overall |
|---|---|---|---|---|---|---|---|
| GAR | 4204 | 2739 | 1683 | 51 | 1333 | 2 | 9999 |
| GAR_60 | 0.079 | 0.051 | 0.379 | 0.009 | 0.021 | 0.000 | 0.155 |
| GAR_GP | 0.021 | 0.014 | 0.009 | 0.000 | 0.007 | 0.000 | 0.051 |
The GAR contributions from defenders are more spread out, but we still see the largest contribution from even strength offense.
If we compare forwards and defenders, we see that an average forward has both a higher GAR_60 and GAR_GP. In other words, a replacement level defender is closer to average than a replacement level forward is. So, either replacement level defenders are better than replacement level forwards or NHL forwards are better than NHL defenders. I think it could be a combination of the two, but the latter probably has the greatest effect.
Why would forwards be better than defenders? If we assume that forwards generally are better hockey players than defenders, then it likely originates from kids and junior hockey. I think players have the greatest impact on the center position, so youth coaches will likely put their best players at the center position. Then when the level increases you will end up with a surplus of good center players. Some of these will be moved to wing, but hardly anyone are moved to defense. This is how you end up with better forwards than defenders.
I think that could be an explanation, but that’s just my theory.
In reality the important question is not, whether forwards are better than defenders, but whether they are more impactful. If we look at the graph below once more, it does seem like the best forwards have a greater impact than the best defenders. Even when we account for time on ice.

Conclusions
- The best forwards seem to have a greater impact than the best defenders. So, if we consider the elite tier from part 1 it will mostly consist of forwards.
- The worst forwards are worse than the worst defenders… but it’s easier to “hide” a bad forward on the 4th line than it is to “hide” a bad defender on the 3rd pairing. So, it’s easier to overcome bad forward depth than bad defender depth solely with ice time decisions.
- In today’s game, forwards and defenders are two completely distinctive positions, and we see no crossover between them. Other sports are moving towards more fluid positions and eventually I think we will see that in hockey as well. It would be fun to see more centers getting moved to defense. Or teams playing with 4 forwards when they’re trailing in the 3rd.
- Offensive and defensive impact is connected to risk/reward. You want your best offensive players to take more risks, because the gain in offensive impact will outweigh the loss in defensive impact.
Data from http://www.Evolving-Hockey.com

2 thoughts on “Talent distribution – Forwards vs. Defenders (Part III)”