This article is written by ImPCT Sport. Make sure to give them a follow on Twitter @ImpctSport.
In my previous publication, I covered the ImPCT Engine. The ImPCT engine is a machine learning based algorithm that was developed to process large amounts of sport related data and provide meaningful intelligence on the performance of players. In the present, we seek to explore Offensive and Defensive quality in the NHL from different angles including their respective impact on the overall performance of players and their Contract Value. In the present, I use data from the 2020-2021 NHL regular season.
Offensive and Defensive quality
Several models to describe sport performance were developed over the years and very early in the development process, overall player quality needs to be separated into offensive and defensive quality. Same is true for anyone trying to make sense of a hockey game where overall skill is separated into offensive skill and defensive skill based on the two objectives of the game: To score more goals than you get scored on.
The first issue with exploring offensive and defensive skills is that they are general concepts and can’t be addressed using one single measure. The last player to touch the puck before it goes into the net is credited with a Goal, however, how to credit the remainder of the players on the Ice? What about the player that carried the puck into the offensive zone? Hence the use of a computer models such as the ImPCT engine, where the engine compiles all accessible variables into one metric of performance by weighting each variable by it’s “learned” value based on an historical dataset.
Reminder: Whereas the Offensive Player Value score is a measure of a player performance’s capacity to generate points for (Goals), and the defensive Player Value score is a measure of the same player performance’s capacity to not give points to the opposition, The Overall Player Value score is a measure of a player performance’s capacity to win or lose the game. Hence, the subject of interest is the relationship between Offensive and Defensive performance on the Overall outcome of the game (or Overall performance).
Offensive/Defensive Quality distributions
To begin, lets explore how Offensive and Defensive quality is distributed across the NHL. For this simulation, we fetched all Average Player Values (Factorized into Offensive and Defensive Values) for players from the NHL 2020-2021 season. The Player Value metric is the Overall value of the player based on his entire performance contribution. The player value score is then factorized into Offensive and Defensive values. The plotted distributions for Offensive and Defensive Values are presented hereunder:
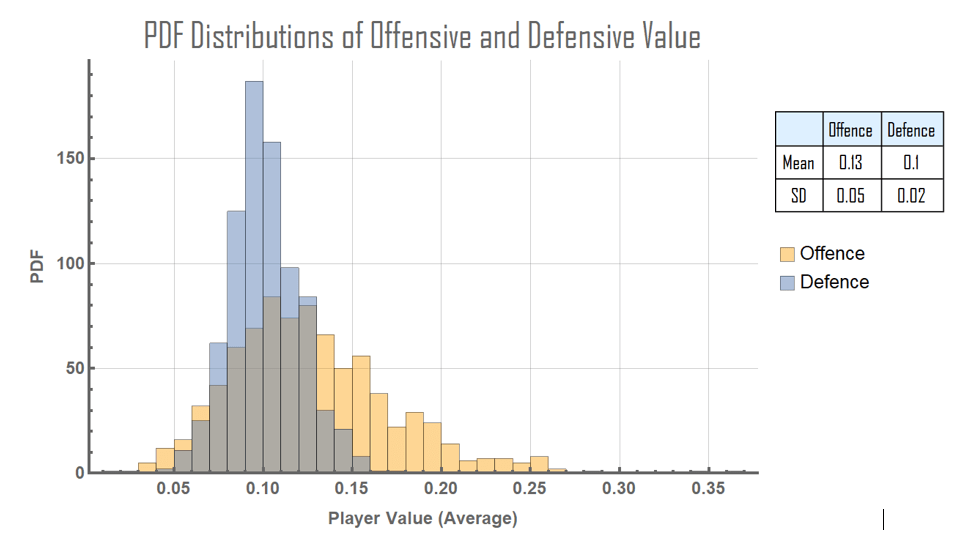
Our first observation is how the spread of the values are different between the two skills. The defensive Player value scores have a much smaller spread in comparison to the Offensive values. The high defensive performers, let’s say the top 5% of defensive performers, don’t distinguish themselves from the average as much as the top 5% offensive players do. However same does not hold true for the poor performers. Our interpretation from the difference in distributions is that the evaluation of offensive and defensive skill cannot be held to the same standard. Defensively, the spread in skill (Player Values) is much lesser, hence the difference between good and bad, elite and support isn’t as distinguishable as it’s offensive counterpart. On the other hand, the wider spread in offensive skill means the ceiling on that skill is much higher. Top talents distinguish themselves from the bulk of the league and is more sparsely found. This difference in distribution is one hypothesis we put forth to explain the effect found in the next section where we examine the value of each skill to the overall performance of players, and their contract value.
Value of Defense and Offence to Winning
A debate we’re all used to is: What wins hockey games? Offence or Defense?
Reminder: For this simulation, I use the Player Value Adjusted Score. The Player Value Adjusted Score is a measure of the value of the contribution of a player at his specific deployment level (1st line, 2nd line, 1st pair, 3rd pair, etc…). For example, once adjusted for the deployment level, a 4th line forward has the same opportunity to receive a high score as a 1st line forward. Whereas the Player Value score is useful to estimate how a player has a higher or lesser value then the next, the Player Value Adjusted score is useful to estimate the fit of a player at his deployment level and whether the performance predicts a team Win or Loss.
To explore the relationship between Offensive and Defensive performance on the overall performance of players, we plotted all three variables in a density plot shown hereunder:

The X axis shows the Offensive Player Value adj. scores obtained by players during the season, and the Y axis shows the Defensive Player Value adj. scores. The density (Red to Blue) shows the resulting Overall Player Value adj. scores resulting of the Offensive and Defensive contributions. The white spaces around the mushroom shape are combinations of offensive/defensive values that did not happen during the season. My first observation is that the “mushroom” is off-axed. That is because of the difference in distributions between the offensive and defensive values. Furthermore, the colour gradient is tilted towards offence, meaning the Offensive Values hold a slight advantage at predicting a game win or loss in comparison to the defensive values.
The difference is small and hard to notice with the naked eye, so I changed the simulation to better show the difference. Our team already calculated the value of the Player Value Adjusted where the metric shifts between a Win (or OTL) prediction to a straight Loss prediction, which we call to Over 1P Value. In the NHL, the value stands 0.55. In the next simulation, any Overall Player Value Adj. score over 0.55 was labeled as a Win, and any score bellow was labeled as a loss. The density plot is shown hereunder:
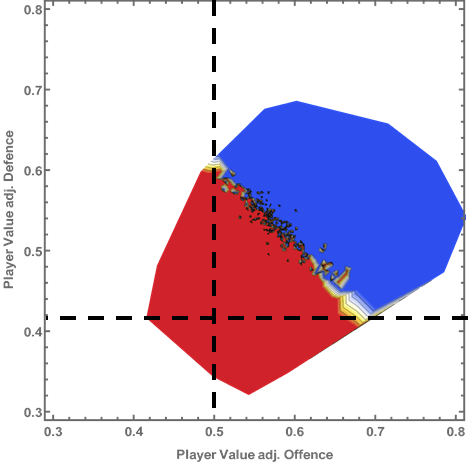
The dashed axis was added at the minimum Offensive and Defensive Values required to have a chance, however small, at predicting a game win. On the offensive side, the minimum value stands at about 0.5, where any offensive performance (observed) below that threshold is predictive of a loss. On the defensive side, the threshold stands at 0.42, meaning that bad defensive performances can be corrected with strong offence at a rate higher than the opposite situation is true (Correcting poor offence with strong defense).
Regression model of Offensive and Defensive values on the Overall Player Value
In order to measure the relative importance of Offence and Defense, I fit a multi-variate regression to fetch each of the offensive and defensive regression coefficients when predicting the overall performance of the player. The best-fit regression model equation is as follow:
Ov. = 1.082 Off. + 0.985 Def. – 0.051
Where Ov. Is the Overall Player Value, Off. Is the Offensive Player Value and Def. is the Defensive player value. The Offensive coefficient being higher than the defensive coefficient, I interpret that Offensive value holds a higher predictive power with regards to the overall performance value than the Defensive value. The relative contribution of Offence and Defence to the Overall Value, based on the regression coefficients, is plotted hereunder:

By curiosity, I performed the exact same strategy, but on the Cap % (Contract Value) used by players. In short, I calculate the relative contribution of Offensive and Defensive performance to the contract value of players. The regression model is described as:
Cap % = 0.279 Off. + 0.128 Def. – 0.016
The relative contribution of both Offence and defense based on the coefficients are charted hereunder:

As is shown, the relative contribution of offence to contract value is disproportionately larger than it’s defensive counterpart. I originally interpreted that Offensive skill is overvalued in the league, and defensive skill undervalued, which might very much be the case. However, another hypothesis is that this effect is explained by the difference in distributions for both skills. Offence as a skill has a higher ceiling than defense, and those highly skilled offensive players hold to a bigger cap % then the highly skilled defensive players, hence offensive performance becomes a better, or sole, predictor of the highly paid players (and high performers).
In order to test the second hypothesis, I standardized all variables (Mean=0 and SD=1) and fitted a nonlinear exponential function on each of the individual variables. The resulting nonlinear functions are shown hereunder:

The results show that from poor to average Offensive and Defensive performers have about the same predicted overall game performance. However, it is the top performers that hold a different Overall game contribution. The top offensive performers hold a higher overall game performance than their defensive counterparts. In short, the experiment confirms that high offensive performers give a better overall game performance output than high defensive performers. This ties into our hypothesis that offence has a higher performance ceiling than defense, and therefore holds a higher overall value than defense. The same relationship holds true when predicting contract value, but to a larger extend:

Team by team analysis
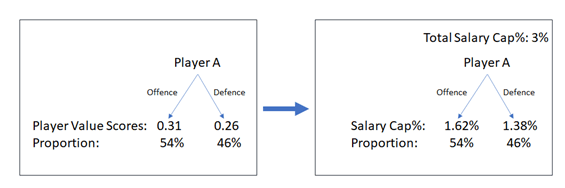
One interesting facet to explore is how each NHL team uses their salary cap space to deploy offensive or defensive performances. Naturally, team managements don’t specifically spend cap space on offence or defense, however through decision making and player evaluation, some teams tend to spend voluntarily more on offence or defense. In order to measure the cap space used by each team on offence and defense, I put together an experiment using the ImPCT Player Value metric and the cap space% used. The experiment goes as follow:
- For each game played by the team, the offensive and defensive Player Value score is calculated for each player.
- The salary cap used by the player for the game played is divided into defensive and offensive salary cap used in the same proportion as the offence vs defense scores. The process is exemplified hereunder.
- The Salary cap proportions are summed for each game, and then averaged over the entire season.
This process gives an idea of the average spending for each team on offence and defence by the year’s end, weighted on the cap space used on each player. The result tables are shown hereunder where the left column shows Average Offensive spending and the right Average Defensive spending:
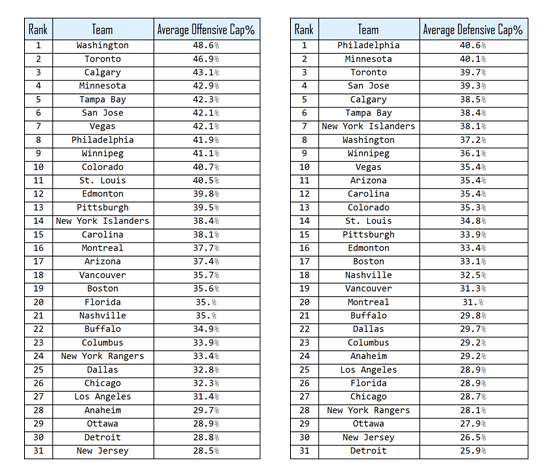
Unsurprisingly, teams like Washington, Toronto and Calgary are the biggest offensive spenders whereas Philadelphia, Minnesota, and Toronto (again) are the biggest defensive spenders. Notice that the offensive and defensive cap% spending does not add up to 100% for any teams, this is because not all teams spend to the cap and injuries/buyouts have an effect where some cap space is used on players that do not play. Furthermore, Goalies hold cap space and are not counted in this experiment. Being that Toronto, last season spent to the cap and avoided big injuries, they show up as both big offensive and defensive spenders.
Furthermore, no team spent more on defense then offence. The differential between offence and defense spending for each team is charted hereunder:

The differential chart shows that no teams spent more on defensive performances than offensive. The spread in differential shows that the difference in offensive and defensive team spending varies from team to team. I particularly take notice of the NY Islanders that almost spent as much on defense than offence and has had a lot a success doing so in the past season.
Conclusion
In this post, I wished to explore the difference between the deployment of offence and defense in the NHL. Firstly, I noticed that there is a large difference in the spread of offensive and defensive skill in the league. The ceiling for offensive performance is higher than the ceiling for defensive performance and the spread of offensive performance (measured by the standard deviation) is larger than the spread of defensive performance. Secondly, Offensive performance is a slightly better predictor of overall game performance (Win or Loss) than Defensive performance, in large part because top offensive performers have a higher positive impact on the overall game performance than the defensive top performers do. The gap between both is even larger when predicting contract value. Finally, the differential between offensive spending and defensive spending varies from team to team, but no NHL team (2020-2021 season) has spent more on defensive performances than offensive performances.

2 thoughts on “Deep Dive into Offensive and Defensive Quality in the NHL”