
This is the 4th article in the talent distribution series. You can find the other articles here: Part 1, Part 2 and Part 3.
This piece will focus on goaltending.
What is rink bias?
You can’t really discuss goaltender statistics without also mentioning rink bias. Very basically, you can say that rink bias is shot tracking differences from arena to arena. In some arenas shot locations are tracked too close to the net, while in other arenas shot locations are tracked too far from the net.
The problem is that shot tracking is done by the home team, and even if these trackers do their very best, there will always be small differences between them. When the same person tracks all home games of a specific team, these differences will accumulate based on home arena.
In a perfect world all shot tracking were automated, so we would have precise shot location data. In a good world all shot tracking were done remotely by a neutral company, so that all trackers would get the same training to minimize differences. And most importantly, trackers could be randomized so that even if there still were differences these wouldn’t accumulate to specific teams.
However, in the current world, shot tracking is done by the home team, and unfortunately that leaves us with biased shot data.
Rink biases will mostly affect home data, since on the road rink biases will mostly even out. To illustrate this, I’ve looked at cumulated GSAx home and away for a few teams. I’ve used GSAx data from evolving-hockey, because it’s not adjusted for rink bias.
Here’s evolving-hockey’s cumulative GSAx home and away for NYR and MIN:


We see quite extreme differences between home GSAx and away GSAx. In New York, home GSAx is larger than away GSAx, meaning shots are tracked too close to the net and goaltenders are overrated. The opposite is the case in Minnesota.
For comparison, here’s the cumulative GSAx using my model:


Now we see much closer home and away performances. Obviously, these rink bias adjustments are based on estimations, so they aren’t perfect. But, I think they give a more realistic indication of goaltender performances.
A while back I wrote this article on rink bias. I think the overall takes still hold.
You can download a list of my rink bias adjustments here. The adjustment is given as a constant, that you can multiply with the unadjusted xG values. If the constant is higher than 1, then the unadjusted xG values are too low (think Minnesota). If the constant is lower than 1, then the unadjusted xG values are too high (think NY Rangers).
My GSAx model
I won’t go into great detail, but my GSAx model is slightly different from others out there. Normally, a GSAx is based on fenwicks against, which credits the goaltender for shot misses. I’m not quite sure that should be the case, and I wrote an article about it.
Instead, my model is based solely on shots against. This way it only credits goaltenders with actual saves. Other than that, I think my model is similar to other models out there.
The connection between GSAx and dFSv%
When we’re talking about modern day goalie stats, it’s typically GSAx (goals saved above expected) and dFSv% (delta fenwick save percentage) we’re talking about.
GSAx = xGA – GA
dFSv% = FSv% – xFSv%
So, GSAx is how many goals the goaltender has saved above expectation and dFSv% is how much better the fenwick save percentage has been compared to the expected save percentage However, not everyone realizes that dFSv% is also the same as GSAx per fenwick against.
dFSv% = FSv% – xFSv% = (1-GA/FA) – (1-xGA/FA) = xGA/FA – GA/FA = (xGA-GA)/FA = GSAx/FA
This is worth noting going forward. You can say that GSAx is the “totals” version and dFSv% (or GSAx/FA) is the “rates” version. In other words, GSAx is to GAR what dFSv% is to GAR per 60. Only with goaltenders we use fenwicks against instead of ice time.
When we look at talent it’s better to look at the “rates” version (dFSv%), because it’s independent of workload/ice time.
As mentioned earlier, my model is based on shots against, so for my model the “rates” version is obviously:
dSv% = Sv% – xSv% = GSAx/SA
Seasonal talent distribution
Now we can look at the actual talent distributions. Firstly, I will look at seasonal data and I will compare 4 different “rates” metrics: Classic Sv%, dSv% from Hockey-Statistics, dFSv% from Evolving-Hockey and dFSv% from TopDownHockey.
Here are those 4 metrics as a function of percentile. The minimum requirement is 700 fenwicks against (around 16-20 games) and that gives us 755 datapoints from 2007-2021:
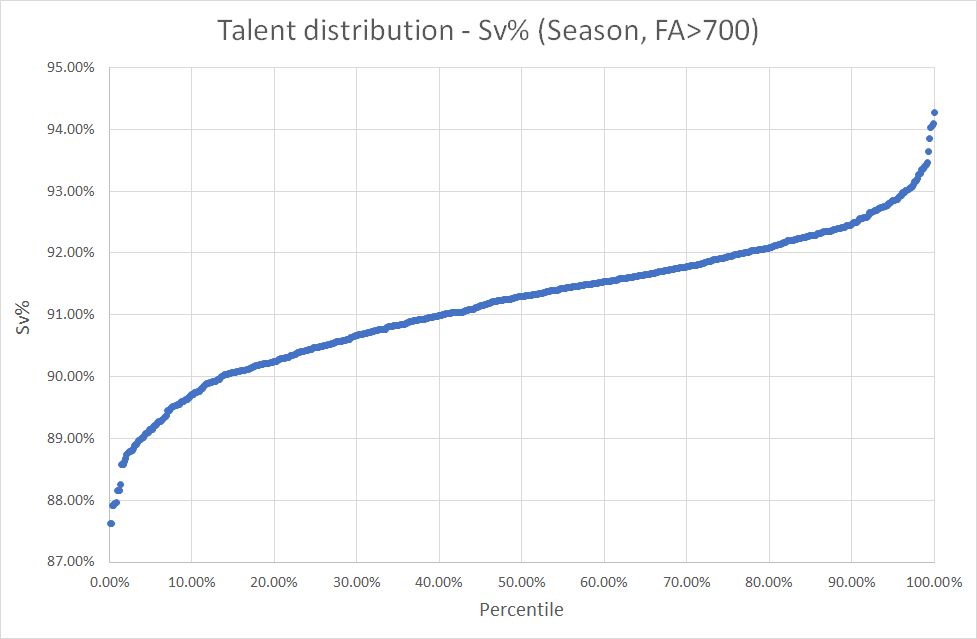
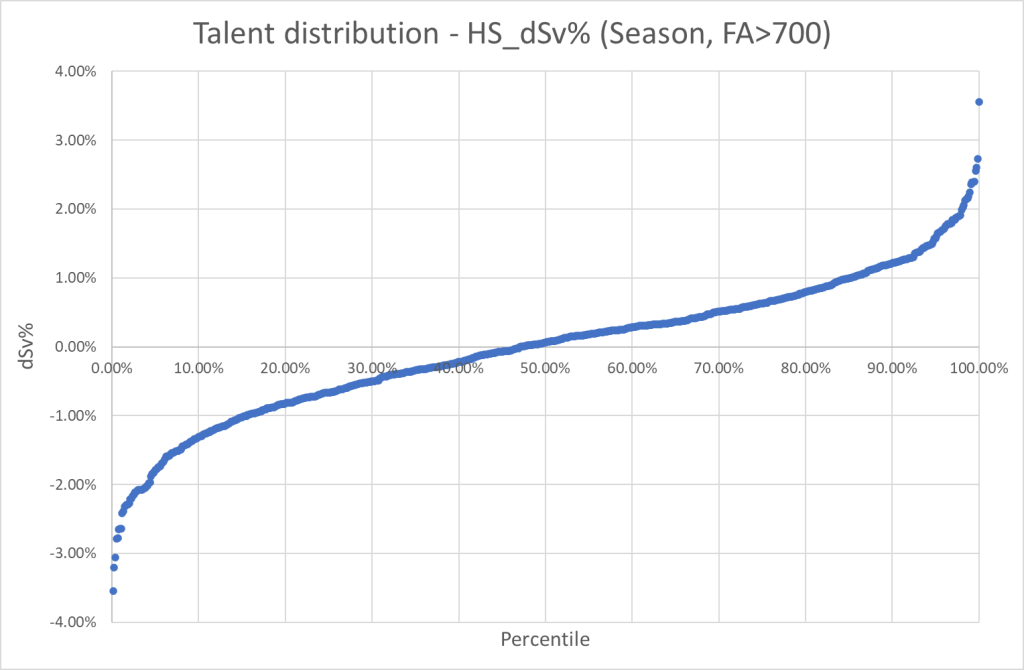
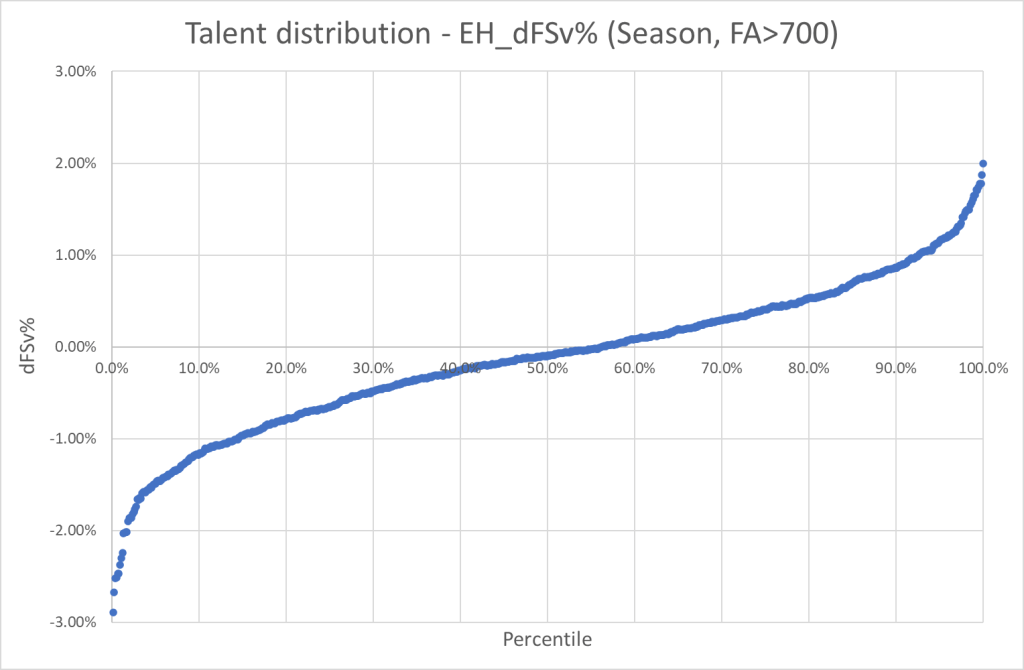
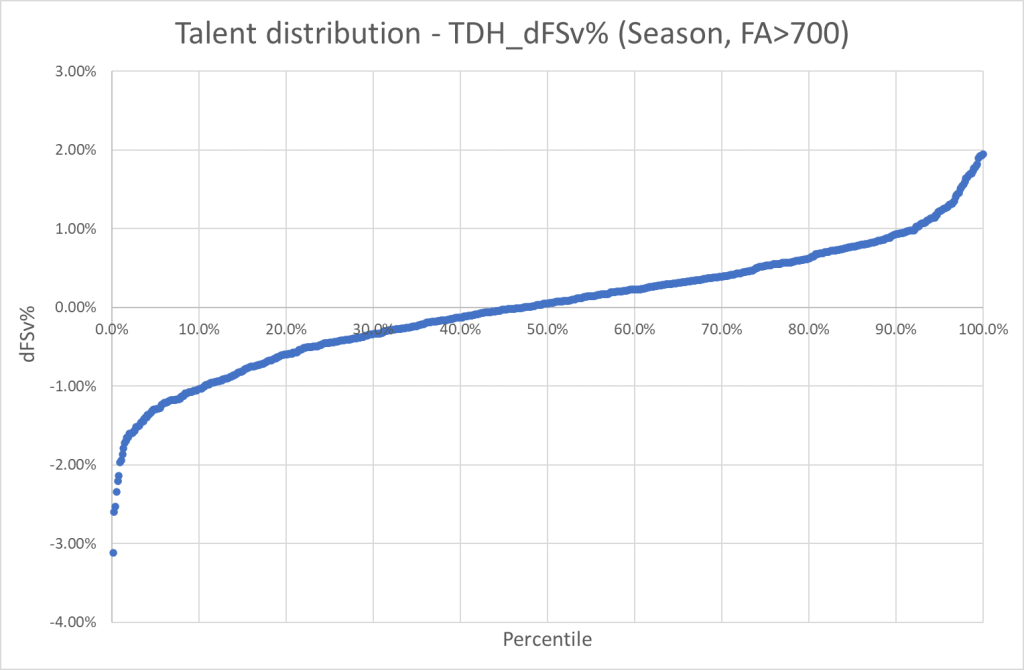
The distributions look mostly similar, but the player rankings are not necessarily similar. Let’s also look at the histograms.


In general, we see distributions skewed towards the bad goaltenders. So, it seems like bad goaltenders have a greater impact than good goaltenders. How much the distribution is skewed depends on the model, but overall it looks as if you will lose more from bad goaltending than you will gain from good goaltending.
That being said, goaltenders probably shouldn’t be judged too much based on single season results, because there’s so much variance in goaltender data!
I also looked at talent/impact vs workload (graph below) and it showed two things:
- There’s a slight correlation between workload and positive impact. You would probably expect a greater difference between starters and backups though.
- The variance decreases with workload, so 700 fenwicks against is likely too small of a sample size.

The talent vs. workload graph is based on my model, but the graphs look the same for the other models.
Career talent distribution
Goaltenders are really tough to evaluate, because there’s so much variance from year to year. So, if we want to look at talent distribution, it’s probably better to look at career data.
Here’s the talent distributions for goaltenders with at least 4000 fenwicks against in their career (around 100 games). This gives us 103 goaltenders and Alexandar Georgiev just made the cut.
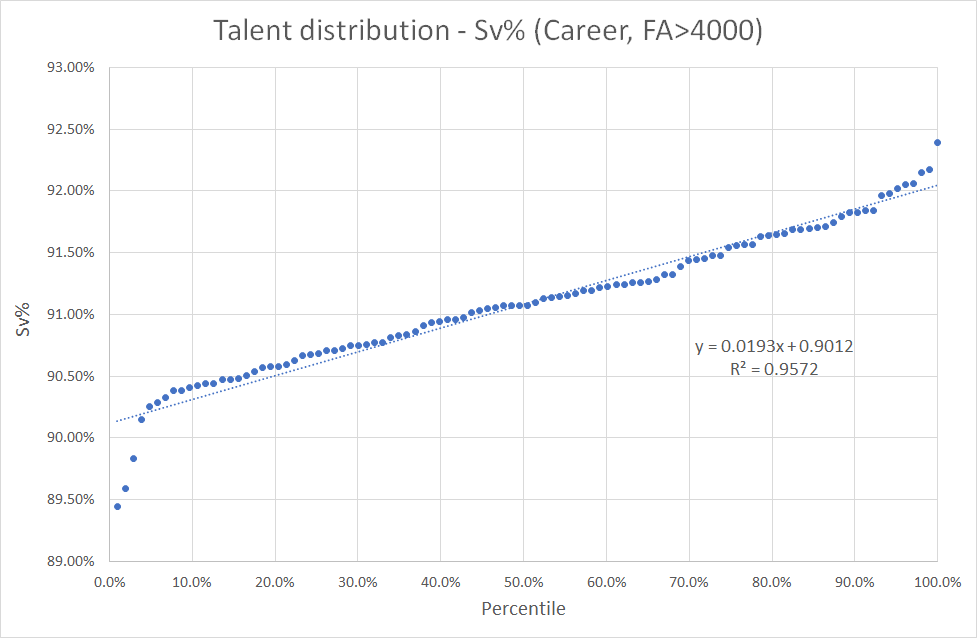


I’ve added a trendline to show how linearly distributed goaltenders are, when we increase the sample size. There’s still a big difference between a good goaltender and a bad goaltender, but I’m not sure there is an elite tier like we saw for the skaters. Especially, since the top goaltenders are different from model to model.
The top goalies
Here’s the top 15 goaltenders in terms of Sv% and how they perform according to the other models:
| Player | Sv% | HS_dSv% | EH_dFSv% | TDH_dFSv% |
|---|---|---|---|---|
| Tim Thomas | 92.39% | 1.01% | 0.22% | 0.66% |
| Tuukka Rask | 92.18% | 0.55% | 0.17% | 0.53% |
| Tomas Vokoun | 92.15% | 0.91% | 0.20% | 0.50% |
| Ben Bishop | 92.06% | 0.56% | 0.27% | 0.39% |
| Philipp Grubauer | 92.05% | 0.98% | 0.49% | 0.77% |
| Juuse Saros | 92.02% | 1.07% | 0.54% | 0.62% |
| Andrei Vasilevskiy | 91.98% | 0.60% | -0.15% | 0.20% |
| Antti Raanta | 91.96% | 0.87% | 0.54% | 0.67% |
| Roberto Luongo | 91.84% | 0.47% | 0.19% | 0.39% |
| Robin Lehner | 91.84% | 0.29% | -0.03% | 0.16% |
| Cory Schneider | 91.82% | 0.86% | 0.37% | 0.50% |
| Henrik Lundqvist | 91.82% | 0.48% | 0.87% | 0.29% |
| Corey Crawford | 91.79% | 0.64% | 0.30% | 0.17% |
| Anton Khudobin | 91.75% | 0.22% | 0.22% | 0.30% |
| Carey Price | 91.71% | 0.40% | 0.18% | 0.41% |
And here’s how they rank in each model
| Player | Sv% | HS_dSv% | EH_dFSv% | TDH_dFSv% |
|---|---|---|---|---|
| Tim Thomas | 1 | 2 | 17 | 3 |
| Tuukka Rask | 2 | 12 | 25 | 6 |
| Tomas Vokoun | 3 | 4 | 20 | 7 |
| Ben Bishop | 4 | 11 | 13 | 13 |
| Philipp Grubauer | 5 | 3 | 5 | 1 |
| Juuse Saros | 6 | 1 | 3 | 4 |
| Andrei Vasilevskiy | 7 | 9 | 47 | 28 |
| Antti Raanta | 8 | 5 | 4 | 2 |
| Roberto Luongo | 9 | 17 | 22 | 14 |
| Robin Lehner | 10 | 24 | 38 | 31 |
| Cory Schneider | 11 | 6 | 7 | 8 |
| Henrik Lundqvist | 12 | 15 | 1 | 20 |
| Corey Crawford | 13 | 8 | 12 | 30 |
| Anton Khudobin | 14 | 28 | 18 | 19 |
| Carey Price | 15 | 22 | 24 | 11 |
I’ve also looked at total GSAx and how it’s distributed. I used GSAA as the “totals” version of Sv%.

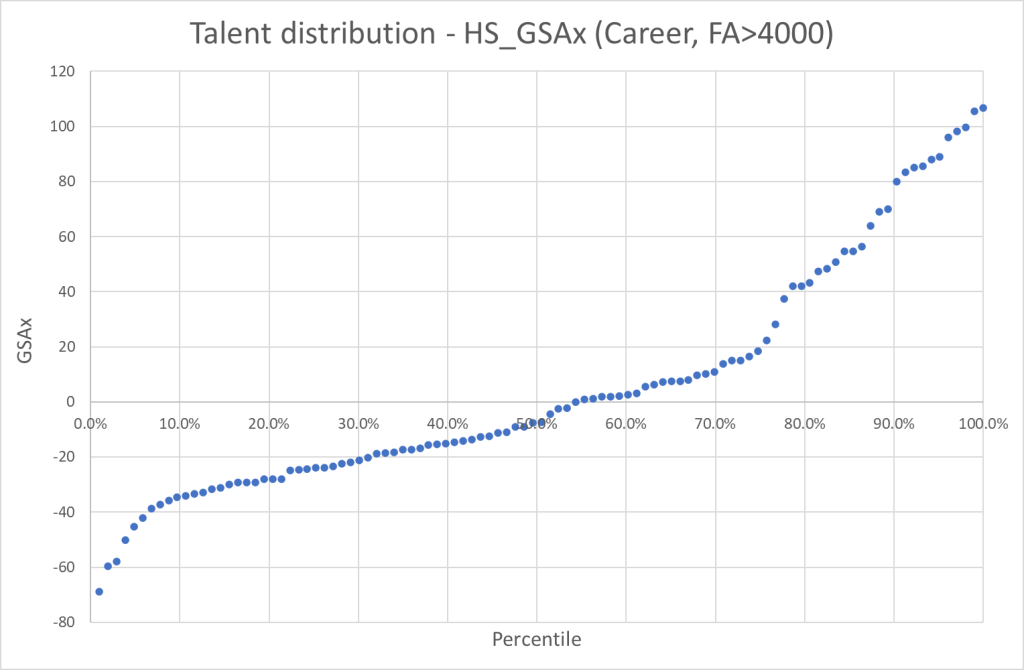
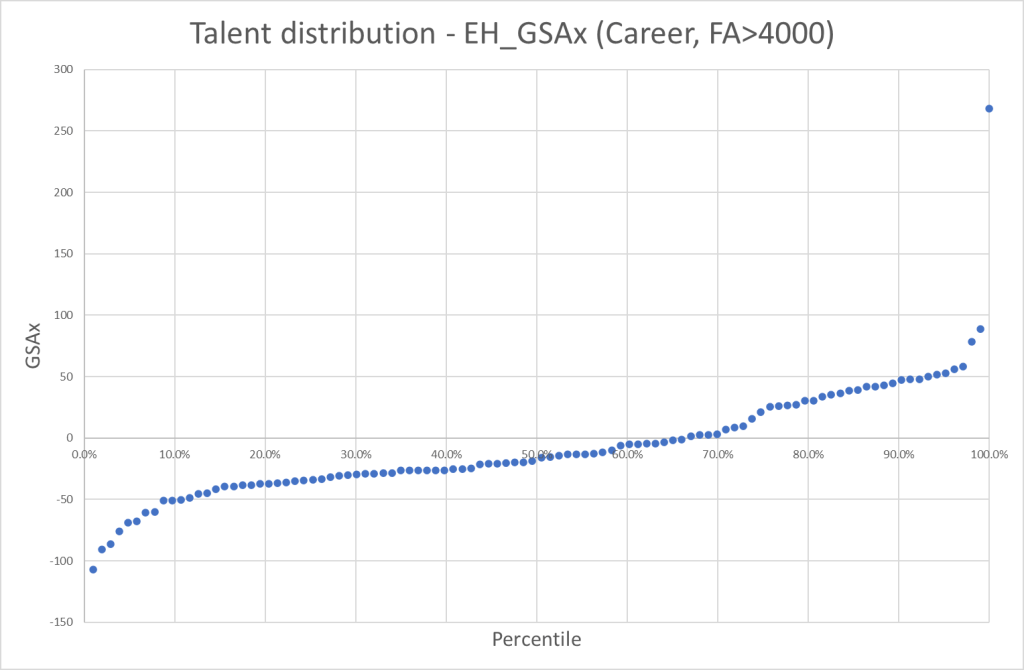

In the Evolving-Hockey graph, we see Henrik Lundqvist being so much better than anyone else that he completely bursts the scale. This is what happens when one of the best goalies in the league play under the best possible rink bias circumstances.
Other than that, we clearly see a distribution skewed towards the better players. This would indicate that above average goaltenders have long careers as starters while goaltenders below average have shorter careers or play in a more limited role.
To show this we can look at dSv% (talent) as a function of fenwicks against (indication of career length/role).

The top goalies
It’s worth looking at the top 15 GSAA goalies, and see how they perform in the other models. Just as a way to compare the models:
| Player | GSAA | HS_GSAx | EH_GSAx | TDH_GSAx |
|---|---|---|---|---|
| Tuukka Rask | 138.2 | 85.5 | 36.7 | 112.7 |
| Henrik Lundqvist | 128.0 | 106.8 | 268.5 | 90.7 |
| Tim Thomas | 114.7 | 95.9 | 27.4 | 82.8 |
| Roberto Luongo | 109.6 | 85.2 | 47.6 | 95.5 |
| Carey Price | 107.0 | 83.5 | 51.4 | 118.4 |
| Tomas Vokoun | 104.7 | 88.1 | 26.4 | 66.7 |
| Pekka Rinne | 90.5 | 15.0 | -26.6 | -19.5 |
| Ben Bishop | 88.4 | 63.8 | 42.0 | 62.3 |
| Andrei Vasilevskiy | 78.0 | 54.7 | -18.7 | 24.9 |
| Marc-Andre Fleury | 76.7 | 99.8 | 30.4 | 71.4 |
| Ryan Miller | 69.0 | 105.6 | 2.6 | 60.6 |
| Corey Crawford | 68.4 | 89.1 | 56.3 | 31.5 |
| Sergei Bobrovsky | 64.6 | 68.9 | 47.6 | 76.6 |
| Jaroslav Halak | 62.5 | 79.9 | 88.7 | 87.9 |
| Semyon Varlamov | 62.1 | 70.1 | 30.2 | 80.8 |
And here are the rankings:
| Player | GSAA | HS_GSAx | EH_GSAx | TDH_GSAx |
|---|---|---|---|---|
| Tuukka Rask | 1 | 8 | 18 | 2 |
| Henrik Lundqvist | 2 | 1 | 1 | 4 |
| Tim Thomas | 3 | 5 | 23 | 6 |
| Roberto Luongo | 4 | 9 | 9 | 3 |
| Carey Price | 5 | 10 | 7 | 1 |
| Tomas Vokoun | 6 | 7 | 24 | 13 |
| Pekka Rinne | 7 | 29 | 67 | 71 |
| Ben Bishop | 8 | 14 | 15 | 15 |
| Andrei Vasilevskiy | 9 | 16 | 53 | 28 |
| Marc-Andre Fleury | 10 | 3 | 21 | 11 |
| Ryan Miller | 11 | 2 | 34 | 18 |
| Corey Crawford | 12 | 6 | 5 | 26 |
| Sergei Bobrovsky | 13 | 13 | 10 | 9 |
| Jaroslav Halak | 14 | 11 | 2 | 5 |
| Semyon Varlamov | 15 | 12 | 22 | 7 |
Predictability
Goaltending is by far the most frustrating part of hockey statistics, and it all comes down to predictability (or the lack thereof). The above analysis was about descriptive goaltender modelling. All of the metrics (including regular Sv%) tries to measure impact of the goaltenders.
Now we will look at how well these metrics predict future performances. To do this we simply compare impact in one year to the impact the following year. The minimum requirement is once again 700 FA in both seasons.
Here’s the results:

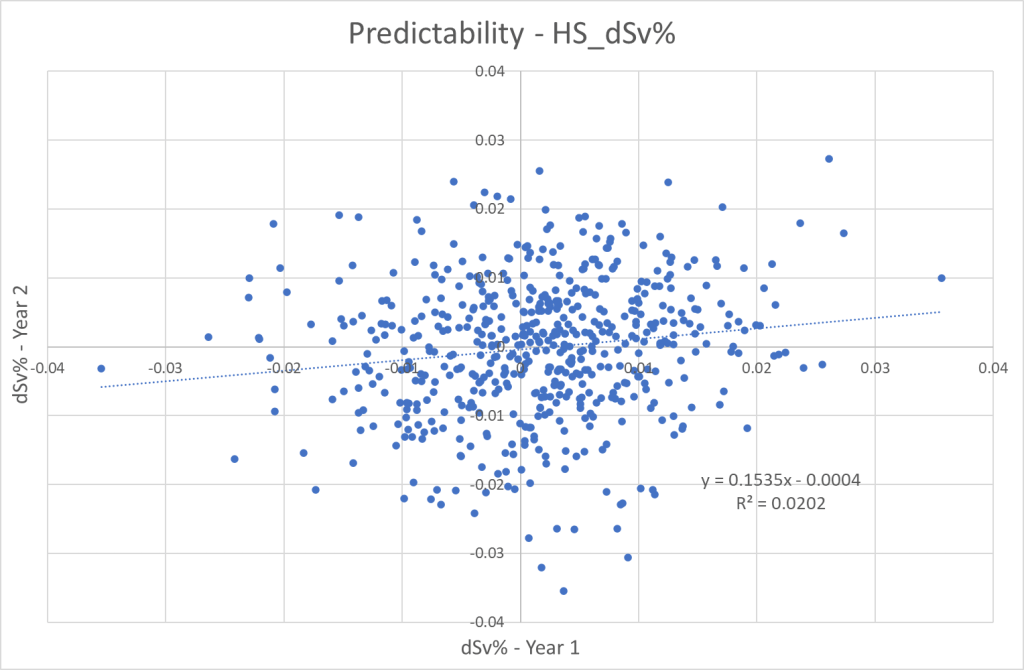

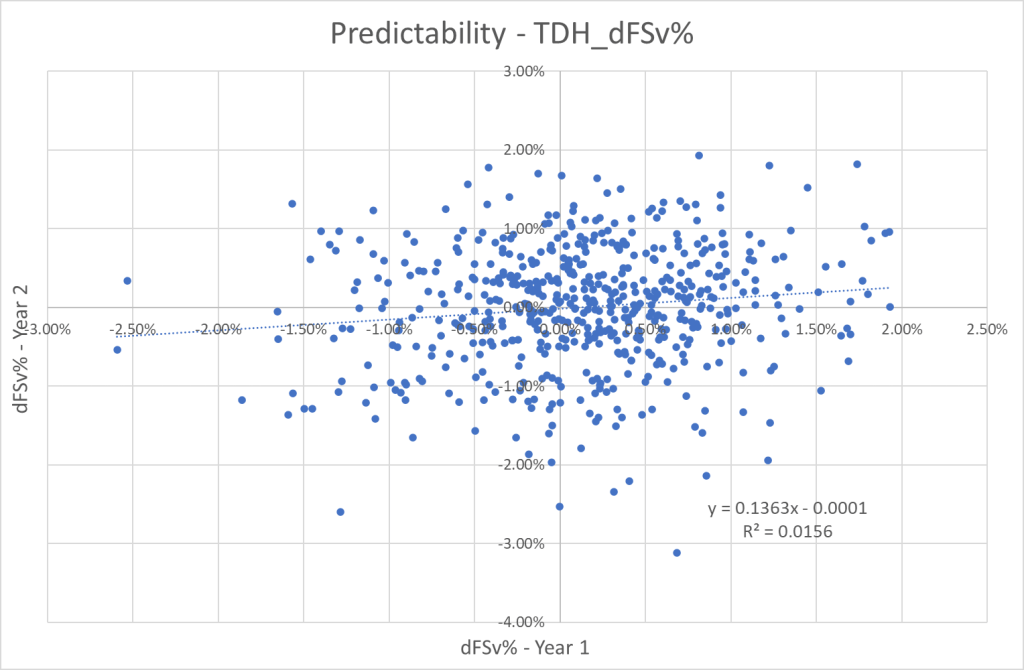
There’s very little correlation between performance one year and performance the next year. This means it’s nearly impossible to predict future goaltender performances based on the current available data.
We see that EH_dFSv% is more repeatable than the rink bias adjusted metrics from Hockey-Statistics and TopDownHockey. This isn’t really surprising since rink bias is relatively consistent from year to year. So, adjusting for rink bias may decrease the repeatability, but it should definitely increase the descriptive quality of the model.
The lack of predictability raises a few questions.
Does GSAx do a good job of measuring goaltender impact? Expected goals models are based primarily on shot location data, but they don’t factor in pre-shot puck movement. This makes you wonder if GSAx really is as good a goalie metric as some make it out to be. I don’t know the answer.
This leads me another question. Are goaltender performances really this random? You can see a goalie be the best one year and sub-replacement level the very next year. This seems weird. Theoretically, goalie performances could be much more consistent than current stats indicate. The stats just don’t catch it.
The reason you use dFSv% instead of Sv% is because you want to isolate goaltender performance from team defense, but it’s probably naive to think that modern goaltender stats can completely isolate goaltending from team defense.
Goaltender impact
The last thing I will do in this article is to try and compare goaltender impact to skater impact. To do this I will look at absolute values of GSAx and compare it sGAA.
Both my sGAA model and GSAx models are calibrated so that the average is always 0 and 1 GSAx/sGAA is worth one goal in team goal differential. This means that we should be able to compare the two models directly.
By looking at absolute values, we see how much the skaters/goalies differ from average – We see their impact regardless if it’s good or bad.
Here’s the seasonal absolute sGAA/GSAx values for all players
| Position | |GSAx/sGAA| | |GSAx/sGAA|_60 |
|---|---|---|
| Goalies | 7940 | 0.242 |
| Forwards | 22409 | 0.232 |
| Defenders | 11645 | 0.181 |
We see that forwards have the greatest overall impact, but when we look at impact per 60, goalies have the bigger impact. Considering goalies also play more, they have by far the greatest seasonal impact. To show this I’ve looked at the top 20 GSAx/sGAA seasons:
| Player | Season | sGAA/GSAx |
|---|---|---|
| Tim Thomas | 10-11 | 40.50 |
| Tim Thomas | 08-09 | 39.77 |
| Mike Smith | 11-12 | 36.83 |
| Ryan Miller | 09-10 | 36.28 |
| Sergei Bobrovsky | 16-17 | 35.00 |
| Carey Price | 14-15 | 31.35 |
| Tomas Vokoun | 08-09 | 30.81 |
| Carey Price | 10-11 | 27.71 |
| Pavel Datsyuk | 07-08 | 25.91 |
| Cory Schneider | 11-12 | 25.77 |
| Roberto Luongo | 10-11 | 25.73 |
| Semyon Varlamov | 13-14 | 25.49 |
| Connor Hellebuyck | 19-20 | 25.36 |
| Ben Bishop | 13-14 | 25.34 |
| Corey Crawford | 15-16 | 25.33 |
| Tomas Vokoun | 09-10 | 24.47 |
| Cory Schneider | 14-15 | 24.42 |
| Jaroslav Halak | 18-19 | 23.82 |
| Brian Elliott | 15-16 | 23.82 |
| Marc-Andre Fleury | 20-21 | 23.73 |
This list consists of 19 goalies and just 1 forward. However, we’ve already shown that there’s very little predictability when it comes to goaltending. So, what happens when we look career impact instead? Here’s the top 20 GSAx/sGAA careers:
| Player | sGAA/GSAx |
|---|---|
| Sidney Crosby | 147.09 |
| Pavel Datsyuk | 132.37 |
| Henrik Lundqvist | 106.81 |
| Ryan Miller | 105.57 |
| Alex Ovechkin | 103.22 |
| Brad Marchand | 101.60 |
| Steven Stamkos | 101.59 |
| Anze Kopitar | 101.05 |
| Joe Thornton | 100.10 |
| Marc-Andre Fleury | 99.76 |
| Joe Pavelski | 99.54 |
| Jonathan Toews | 99.41 |
| Cory Schneider | 98.16 |
| Evgeni Malkin | 96.33 |
| Tim Thomas | 95.92 |
| Mark Giordano | 92.45 |
| Connor McDavid | 90.54 |
| Corey Crawford | 89.07 |
| Tomas Vokoun | 88.06 |
| Claude Giroux | 86.86 |
Now, we see a combination of forwards and goalies (+Giordano). So, when we just look at single season impact, goaltenders have a greater impact than skaters. But when we increase the sample size and look at career numbers, then the best forwards have a similar (or greater) impact than the best goalies.
Summary
- Goaltender performances are almost impossible to predict. It’s difficult so say, if this is due to bad models/data or if goaltending performances just are this random.
- On a seasonal basis the talent distribution is skewed towards the bad goaltenders, indicating that the negative impact of the bad goalies is greater than the positive impact of the good goalies. When looking at career stats the differences are smaller, and almost linearly distributed.
- When you look at total GSAx, there is a pretty good correlation between talent and career length/workload.
- Goaltending is obviously extremely important, but it’s difficult to predict, so overcommiting to one goaltender is a bad idea, unless you’re very confident in his ability. It may be preferable to go with an 1A/1B tandem, since it gives you two chances for a great performance. Very few goalies are good year after year.
- Goaltenders have greater seasonal impact (good or bad) than skaters, but not necessarily greater career impact.
Data from Evolving-Hockey and TopDownHockey

One thought on “Talent distribution – Goaltending (Part IV)”