
Abstract
The goal in this article is to determine whether xG data is impacted by where the games are being played. Do certain arenas impact the shot location data one way or the other?
All data for this article is 5v5 data from www.evolving-hockey.com
Henrik Lundqvist vs. Tuukka Rask
A big part of the inspiration for this article came from looking at Henrik Lundqvist’s GSAx numbers. Either Lundqvist is superhuman, or there’s something off about the expected goals numbers for the New York Rangers. Here’s a list of the top 10 goalies in terms of 5v5 GSAx from Evolving-Hockey:
| Player | GP | FA | xGA | xGA/FA | Sv% | dFSv% | GSAA | GSAx |
|---|---|---|---|---|---|---|---|---|
| Henrik Lundqvist | 764 | 23900 | 1465.8 | 0.0613 | 92.72 | 0.92 | 92.26 | 219.81 |
| Jaroslav Halak | 504 | 15439 | 891.8 | 0.0578 | 92.56 | 0.45 | 41.31 | 68.82 |
| Corey Crawford | 486 | 14564 | 855.6 | 0.0587 | 92.75 | 0.42 | 57.93 | 61.58 |
| Braden Holtby | 468 | 14614 | 829.5 | 0.0568 | 92.60 | 0.37 | 39.46 | 54.48 |
| Sergei Bobrovsky | 507 | 15854 | 900.9 | 0.0568 | 92.67 | 0.33 | 54.57 | 51.92 |
| John Gibson | 287 | 9305 | 535.9 | 0.0576 | 92.57 | 0.53 | 26.08 | 48.93 |
| Jonas Hiller | 404 | 12179 | 683.5 | 0.0561 | 92.54 | 0.40 | 29.57 | 48.46 |
| Roberto Luongo | 626 | 18623 | 1029.2 | 0.0553 | 92.80 | 0.25 | 82.06 | 47.18 |
| Carey Price | 682 | 21019 | 1166.1 | 0.0555 | 92.75 | 0.22 | 91.40 | 46.06 |
| Cam Ward | 611 | 19294 | 1139.1 | 0.0590 | 92.02 | 0.23 | -24.70 | 44.09 |
If we instead look at the top 10 GSAA goalies, we see another picture. Lundqvist is still really good, but nowhere near superhuman.
| Player | GP | FA | xGA | xGA/FA | Sv% | dFSv% | GSAA | GSAx |
|---|---|---|---|---|---|---|---|---|
| Tuukka Rask | 536 | 16011 | 830.9 | 0.0519 | 93.06 | 0.17 | 97.28 | 27.93 |
| Pekka Rinne | 657 | 19922 | 1056.8 | 0.0530 | 92.85 | 0.07 | 95.83 | 14.84 |
| Henrik Lundqvist | 764 | 23900 | 1465.8 | 0.0613 | 92.72 | 0.92 | 92.26 | 219.81 |
| Carey Price | 682 | 21019 | 1166.1 | 0.0555 | 92.75 | 0.22 | 91.40 | 46.06 |
| Roberto Luongo | 626 | 18623 | 1029.2 | 0.0553 | 92.80 | 0.25 | 82.06 | 47.18 |
| Tim Thomas | 317 | 9530 | 510.3 | 0.0535 | 93.16 | 0.20 | 73.36 | 19.28 |
| Tomas Vokoun | 316 | 10062 | 530.5 | 0.0527 | 93.03 | 0.11 | 68.74 | 11.48 |
| Corey Crawford | 486 | 14564 | 855.6 | 0.0587 | 92.75 | 0.42 | 57.93 | 61.58 |
| Sergei Bobrovsky | 507 | 15854 | 900.9 | 0.0568 | 92.67 | 0.33 | 54.57 | 51.92 |
| Ryan Miller | 650 | 20260 | 1113.7 | 0.0550 | 92.54 | 0.07 | 51.80 | 13.72 |
I’ve also looked at the shot quality faced, and I have defined Shot Quality (SQ) as expected goals per fenwick. This is a metric I will use numerous times during this article. If we look at the shot quality faced amongst goalies with at least 200 games played, we find Lundqvist at the very top. So, according to Evolving-Hockey’s xG-model, Lundqvist has faced the hardest shots – 6.1 percent of all unblocked shots against is expected go in.
Here’s the top 10 in SQ (GP>200):
| Player | GP | FA | xGA | xGA/FA | Sv% | dFSv% | GSAA | GSAx |
|---|---|---|---|---|---|---|---|---|
| Henrik Lundqvist | 764 | 23900 | 1465.8 | 0.0613 | 92.72 | 0.92 | 92.26 | 219.81 |
| Ondrej Pavelec | 398 | 12142 | 729.2 | 0.0601 | 91.86 | 0.10 | -31.25 | 12.24 |
| Nikolai Khabibulin | 212 | 6069 | 363.4 | 0.0599 | 91.73 | -0.16 | -17.82 | -9.61 |
| Cam Ward | 611 | 19294 | 1139.1 | 0.0590 | 92.02 | 0.23 | -24.70 | 44.09 |
| Cam Talbot | 314 | 10210 | 601.3 | 0.0589 | 92.35 | 0.35 | 6.58 | 35.25 |
| Corey Crawford | 486 | 14564 | 855.6 | 0.0587 | 92.75 | 0.42 | 57.93 | 61.58 |
| Evgeni Nabokov | 344 | 9766 | 572.1 | 0.0586 | 92.00 | 0.15 | -7.37 | 15.09 |
| Petr Mrazek | 263 | 7661 | 445.3 | 0.0581 | 92.26 | 0.17 | 1.53 | 13.32 |
| Martin Jones | 327 | 9675 | 562.3 | 0.0581 | 91.23 | -0.39 | -67.89 | -37.73 |
| Chris Mason | 233 | 6150 | 356.2 | 0.0579 | 91.45 | -0.37 | -27.93 | -22.83 |
And here’s the other end of the spectrum – the bottom 10 in SQ (GP>200):
| Player | GP | FA | xGA | xGA/FA | Sv% | dFSv% | GSAA | GSAx |
|---|---|---|---|---|---|---|---|---|
| Niklas Backstrom | 371 | 10956 | 534.2 | 0.0488 | 92.20 | -0.69 | 5.45 | -75.78 |
| Devan Dubnyk | 520 | 16285 | 841.2 | 0.0517 | 92.42 | -0.23 | 23.32 | -36.85 |
| Andrei Vasilevskiy | 260 | 8215 | 425.5 | 0.0518 | 92.79 | -0.15 | 38.49 | -12.49 |
| Miikka Kiprusoff | 390 | 11316 | 587.2 | 0.0519 | 91.95 | -0.58 | -13.08 | -65.79 |
| Tuukka Rask | 536 | 16011 | 830.9 | 0.0519 | 93.06 | 0.17 | 97.28 | 27.93 |
| Darcy Kuemper | 215 | 6806 | 353.4 | 0.0519 | 92.41 | -0.19 | 12.15 | -12.64 |
| Peter Budaj | 277 | 7721 | 406.5 | 0.0526 | 91.78 | -0.50 | -21.97 | -38.53 |
| Tomas Vokoun | 316 | 10062 | 530.5 | 0.0527 | 93.03 | 0.11 | 68.74 | 11.48 |
| Pekka Rinne | 657 | 19922 | 1056.8 | 0.0530 | 92.85 | 0.07 | 95.83 | 14.84 |
| Robin Lehner | 301 | 9817 | 522.7 | 0.0532 | 92.49 | -0.25 | 21.32 | -24.29 |
Some teams obviously play a higher risk game, and therefore allows higher danger chances, so we could just accept the data. However, if we look at the numbers Home vs. Away, we see some interesting trends.
The table below shows the shot quality faced being much higher at home than it is on the road for Henrik Lundqvist. This would suggest that NYR plays a much more high-risk game at home, but then we would expect a much lower save percentage as well. We don’t see that, and so the GSAx at home is much higher than the GSAx on the road. The numbers show a great Lundqvist on the road, and a completely unreal Lundqvist at home. Maybe the home ice data is inflated.
| Lundqvist | GP | FA | xGA | xGA/FA | Sv% | dFSv% | GSAx |
|---|---|---|---|---|---|---|---|
| Away | 357 | 11713 | 663.8 | 0.0566 | 92.89 | 0.55 | 64.83 |
| Home | 407 | 12187 | 802.1 | 0.0668 | 92.56 | 1.27 | 155.13 |
| Total | 764 | 23900 | 1466.0 | 0.0620 | 92.72 | 0.92 | 219.96 |
If we do the same analysis for Tuukka Rask, we see a totally different picture. His numbers on the road is very comparable to Lundqvist’s road numbers, but at home he’s way, way worse – in fact he’s below average in terms GSAx at home.
| Rask | GP | FA | xGA | xGA/FA | Sv% | dFSv% | GSAx |
|---|---|---|---|---|---|---|---|
| Away | 256 | 7839 | 425.8 | 0.0537 | 92.87 | 0.39 | 30.81 |
| Home | 280 | 8172 | 405.2 | 0.0502 | 93.23 | -0.03 | -2.80 |
| Total | 536 | 16011 | 831.0 | 0.0518 | 93.06 | 0.17 | 28.01 |
These examples could indicate, that there’s something wrong with the xG data. That shot location tracking is different depending on the arena. However, this is just anecdotal evidence, so I will take a more general approach now.
Arena Effect
You would expect some correlation between Shot quality and goalscoring, so if the Shot quality is higher at certain arenas, you would expect the goalscoring to be higher as well. To test this, I’ve defined Shot result (SR) as goals per fenwick.
So, Shot quality is simply expected goals per fenwick and Shot result is actual goals per fenwick. How well does SQ and SR correlate? I’ve looked at 5v5 team data since the 2007/2008 season. The graph below shows how Shot quality correlates with Shot result for each team in every season:

I honestly expected a greater correlation, but obviously goaltending and shooting ability plays an integral part in goalscoring as well.
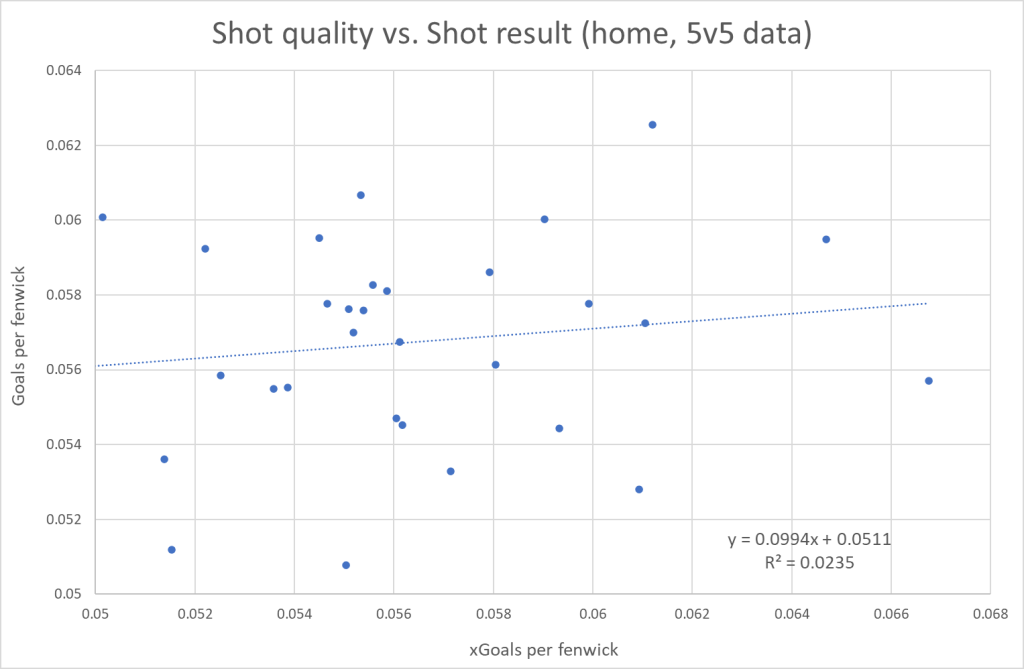
Let’s now look at the correlation at home versus on the road. I’m using overall Shot quality and overall Shot result, so it’s:
SQ = (xGF+xGA) / (FF+FA)
SR = (GF+GA) / (FF+FA)
This means that both teams shooting is accounted for. If there’s no Arena effect then we should see similar correlation Home and Away.

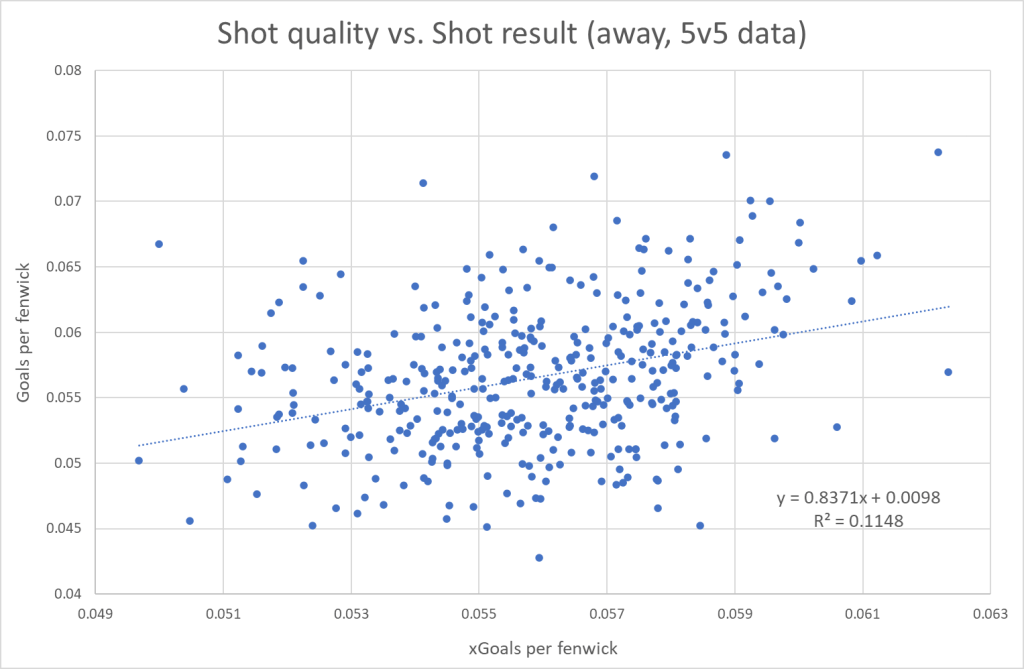
The correlation Away is much greater than it is at home. This indicates that there is an Arena effect on xG and therefore on the shot location data.
I’ve also looked at the correlation between Shot quality and Shot result, when I’m adding the data from all seasons. In other words, it’s how each team has performed from 2007 to 2020 – Atlanta, Winnipeg and Vegas are included even though their dataset is smaller.

Now, we see the Arena effect much clearer. When we use a sample size this large the noise from goaltending and shooting ability becomes much smaller.
How can we then define this Arena effect? I’ve simply defined Arena effect as the Shot quality at home minus the Shot quality away:
Arena effect = SQ(Home) – SQ(Away)
Or
Arena effect = (xGF(H)+xGA(H)) / (FF(H)+FA(H)) – (xGF(A)+xGA(A)) / (FF(A)+FA(A))
The thought process is that the tracking differences accumulate at home, but evens out on the road. The Away data can therefore be seen as a baseline.
With this definition of Arena effect, we can compare teams. Here are the top 10 teams in terms of Arena effect.
Top 10 – Arena Effect:
| Team | Season | SR Home | SR Away | SQ Home | SQ Away | Arena Effect |
|---|---|---|---|---|---|---|
| NYR | 09/10 | 0.0563 | 0.0534 | 0.0763 | 0.0540 | 0.02228 |
| NYR | 11/12 | 0.0540 | 0.0583 | 0.0739 | 0.0551 | 0.01879 |
| NYR | 10/11 | 0.0597 | 0.0504 | 0.0759 | 0.0575 | 0.01846 |
| NYR | 08/09 | 0.0477 | 0.0559 | 0.0717 | 0.0560 | 0.01563 |
| NYI | 14/15 | 0.0581 | 0.0597 | 0.0719 | 0.0565 | 0.01546 |
| NYI | 13/14 | 0.0573 | 0.0588 | 0.0695 | 0.0544 | 0.01504 |
| NYI | 12/13 | 0.0598 | 0.0617 | 0.0695 | 0.0555 | 0.01392 |
| NYR | 07/08 | 0.0497 | 0.0545 | 0.0660 | 0.0532 | 0.01289 |
| WPG | 14/15 | 0.0603 | 0.0474 | 0.0660 | 0.0532 | 0.01275 |
| NYR | 12/13 | 0.0546 | 0.0458 | 0.0666 | 0.0545 | 0.01214 |
This list is dominated by early NYR teams, giving a plausible explanation for Henrik Lundqvist’s superhuman GSAx stats.
Bottom 10 – Arena Effect:
| Team | Season | SR Home | SR Away | SQ Home | SQ Away | Arena Effect |
|---|---|---|---|---|---|---|
| T.B | 12/13 | 0.0626 | 0.0668 | 0.0442 | 0.0600 | -0.01577 |
| T.B | 14/15 | 0.0592 | 0.0648 | 0.0494 | 0.0602 | -0.01079 |
| PIT | 09/10 | 0.0636 | 0.0624 | 0.0510 | 0.0608 | -0.00980 |
| ARI | 12/13 | 0.0578 | 0.0453 | 0.0487 | 0.0585 | -0.00977 |
| T.B | 13/14 | 0.0546 | 0.0511 | 0.0477 | 0.0574 | -0.00970 |
| TOR | 12/13 | 0.0631 | 0.0622 | 0.0481 | 0.0578 | -0.00969 |
| PIT | 12/13 | 0.0584 | 0.0599 | 0.0492 | 0.0588 | -0.00964 |
| BUF | 16/17 | 0.0474 | 0.0520 | 0.0469 | 0.0562 | -0.00932 |
| BUF | 07/08 | 0.0743 | 0.0571 | 0.0497 | 0.0590 | -0.00928 |
| MIN | 07/08 | 0.0544 | 0.0615 | 0.0425 | 0.0517 | -0.00923 |
Not quite as dominated by one particular team, but we see T.B appear numerous times. Here is the overall result, if we look at all seasons combined
Arena Effect – All seasons:
| Team | SR Home | SR Away | SQ Home | SQ Away | Arena Effect |
|---|---|---|---|---|---|
| NYR | 0.0557 | 0.0545 | 0.0668 | 0.0561 | 0.01063 |
| NYI | 0.0595 | 0.0558 | 0.0647 | 0.0563 | 0.00838 |
| S.J | 0.0544 | 0.0561 | 0.0593 | 0.0547 | 0.00465 |
| WPG | 0.0578 | 0.0573 | 0.0599 | 0.0553 | 0.00461 |
| ATL | 0.0626 | 0.0606 | 0.0612 | 0.0568 | 0.00436 |
| EDM | 0.0572 | 0.0604 | 0.0611 | 0.0569 | 0.00416 |
| CAR | 0.0528 | 0.0571 | 0.0609 | 0.0569 | 0.00407 |
| CHI | 0.0600 | 0.0584 | 0.0590 | 0.0569 | 0.00218 |
| PHI | 0.0561 | 0.0582 | 0.0580 | 0.0560 | 0.00204 |
| ANA | 0.0533 | 0.0552 | 0.0571 | 0.0555 | 0.00165 |
| DAL | 0.0547 | 0.0582 | 0.0560 | 0.0552 | 0.00085 |
| MTL | 0.0545 | 0.0553 | 0.0562 | 0.0555 | 0.00070 |
| L.A | 0.0508 | 0.0531 | 0.0550 | 0.0545 | 0.00055 |
| VAN | 0.0581 | 0.0542 | 0.0559 | 0.0556 | 0.00025 |
| DET | 0.0570 | 0.0558 | 0.0552 | 0.0551 | 0.00013 |
| CGY | 0.0607 | 0.0555 | 0.0553 | 0.0552 | 0.00010 |
| OTT | 0.0576 | 0.0578 | 0.0554 | 0.0555 | -0.00013 |
| N.J | 0.0583 | 0.0531 | 0.0556 | 0.0559 | -0.00030 |
| WSH | 0.0567 | 0.0589 | 0.0561 | 0.0565 | -0.00035 |
| STL | 0.0576 | 0.0551 | 0.0551 | 0.0555 | -0.00045 |
| VGK | 0.0586 | 0.0591 | 0.0579 | 0.0584 | -0.00050 |
| NSH | 0.0555 | 0.0564 | 0.0539 | 0.0546 | -0.00072 |
| CBJ | 0.0578 | 0.0577 | 0.0547 | 0.0558 | -0.00109 |
| PIT | 0.0595 | 0.0582 | 0.0545 | 0.0574 | -0.00286 |
| BOS | 0.0536 | 0.0540 | 0.0514 | 0.0545 | -0.00309 |
| COL | 0.0592 | 0.0553 | 0.0522 | 0.0558 | -0.00355 |
| FLA | 0.0559 | 0.0567 | 0.0525 | 0.0561 | -0.00355 |
| ARI | 0.0512 | 0.0528 | 0.0515 | 0.0553 | -0.00381 |
| TOR | 0.0555 | 0.0604 | 0.0536 | 0.0577 | -0.00416 |
| BUF | 0.0560 | 0.0550 | 0.0497 | 0.0564 | -0.00667 |
| MIN | 0.0562 | 0.0557 | 0.0476 | 0.0546 | -0.00701 |
| T.B | 0.0601 | 0.0601 | 0.0501 | 0.0579 | -0.00780 |
The New Yorker teams tops the list, whereas T.B, MIN and BUF have the lowest Arena effect.
If we look at the top and bottom teams from the first two tables, we won’t find any current teams. This could indicate, that the shot tracking has become more streamlined, and it’s all a problem of the past.
I’ve therefore looked at the average Arena effect (positive or negative) over time to see if the effect is trending downwards:

The effect is definitely smaller now compared to earlier, but it’s still pretty significant. And something crazy happened in the shortened 2012/2013 season. Obviously, the sample was smaller, but I don’t think that alone can explain such a spike in Arena effect.
Arena Effect and GSAx
Previously in the article I looked at specific goalies, and how Shot quality affected their numbers. Now I will take a more general approach, and look at how Arena effect correlates with a team’s home ice GSAx:

There’s a pretty good correlation, and if we look at data from all seasons combined instead of single-season data, the correlation is even greater:

Overall, there seems to be a really good correlation between home ice GSAx and Arena effect, so people should be very cautious when using GSAx as their preferred goalie metric.
Arena Effect and GAR
Clearly these Arena effects doesn’t just impact goaltending, so now I will turn my attention towards GAR – more specifically towards the even strength components of GAR (offense and defense).
Unfortunately, I can’t isolate GAR numbers in terms of home ice, so I will have to look at both home and away data. Here’s the correlation between GAR_EVO (offense) and Arena effect on the team level:

So, there’s no correlation between the two at the team level. Theoretically, Arena effects could still impact the GAR_EVO of certain type of players, but at the team level there appear to be no impact.
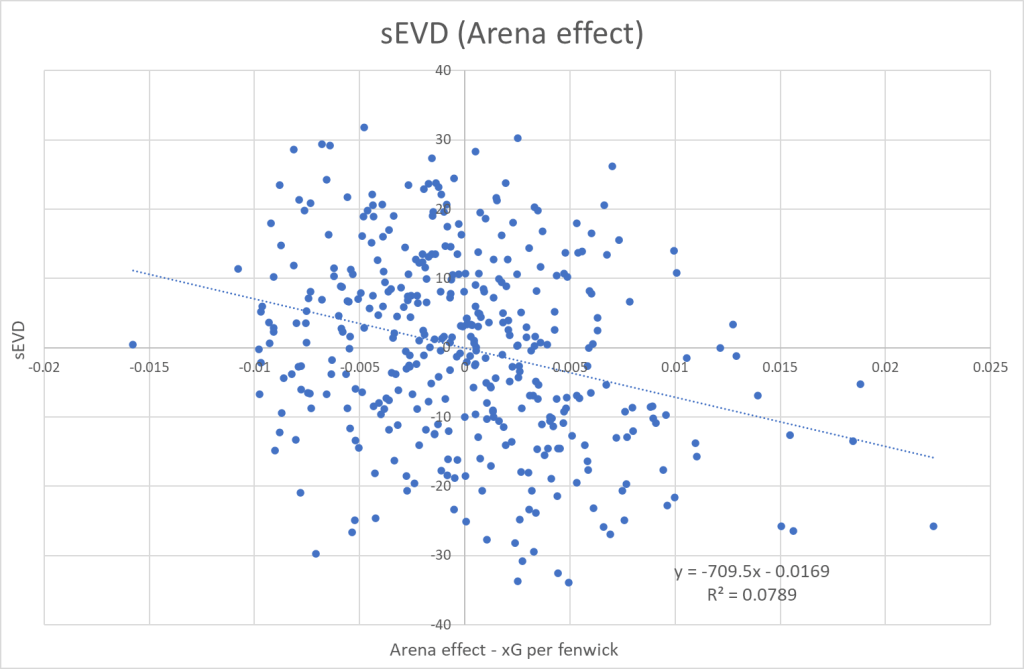
And, here’s the correlation between Arena effect and GAR_EVD (defense):

Now we see some inverse correlation, meaning a high Arena effect decreases the team GAR_EVD, whereas a low Arena effect increases the GAR_EVD. This isn’t particularly surprising, since GAR_EVD relies heavily on xGA.
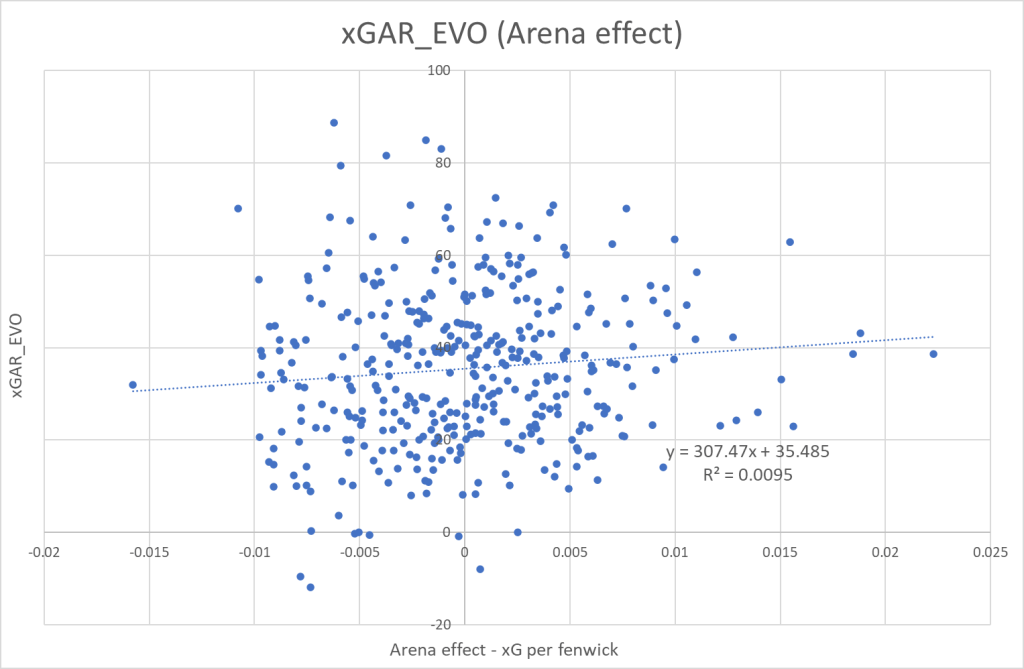
I’ve done the same for the xGAR model with similar results, although not as clear:

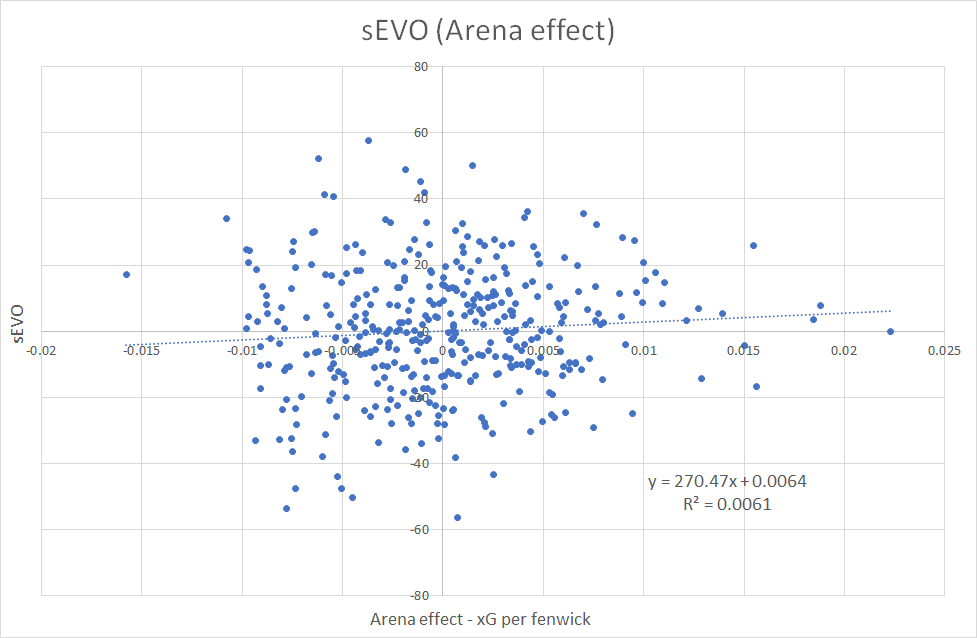
Finally, I did the same analysis of my own model (sGAA), which you can read about here. The results were pretty much the same:
Discussion
The findings in this article raise quite a few questions. First of all, why do we see these differences in Arena Effect? The rink dimensions are exactly the same in every NHL Arena, so you really shouldn’t see such big differences in the shot location data. The only viable explanation I can come with lies in the tracking process. Every game is tracked manually with a specific team of trackers associated with each Arena. From a scientific standpoint, this isn’t a great way to track data, since even small tracking differences accumulate onto specific teams. Instead they should randomize the tracking teams, so that the differences would even out.
Another question raised by these findings, is how to use and interpret this newfound information. I’ve already shown that there’s a correlation between Arena effect and GSAx and there’s an inverse correlation between Arena effect and the defensive GAR components.
So, how does the Arena effect affect xGF%? A high Arena effect increases the xG totals, whereas a low Arena effect decreases the xG totals. The Arena effect should therefore primarily impact the extremities. A high Arena effect pushes players further away from the average (xGF% = 50), and a low Arena effect pulls players towards league average.
On a team like NYR with a high Arena effect this means that a player like Artemi Panarin has a xGF% that seems better than it really is, whereas a player like Kaapo Kakko seem worse than he really is.
One analytical approach to all of this, is to only look at road data. This way the tracking differences should even out. It’s easy to do on www.naturalstattrick.com, but unfortunately home/away is not a sorting criteria on www.Evolving-hockey.com.
Perspective
The positive in all of this, is that the Arena effects seem to be fairly consistent from year to year, so it’s possible to adjust for it. I’ve already tried factoring in Arena effects when looking at GSAx, and it does increase the repeatability of GSAx. Goaltending is still unpredictable, but at least this helps ever so slightly.
In the near future shot tracking will become automated and all of this will be obsolete, but until then adjustments to the current xG models are needed.
Besides from using data from www.evolving-hockey.com, I’ve also calculated the Arena effect using xG-models from www.naturalstattrick.com and www.moneypuck.com.
The findings from NaturalStatTrick were very similar, but MoneyPuck already accounts for the arena differences. However, the approach used on MoneyPuck is very different, so I still think some adjustment is needed. For goalie evaluations I would definitely recommend using MoneyPuck or only looking at road data.
All data in this article is from www.Evolving-hockey.com.
Also thanks to www.naturalstatrick.com and www.Moneypuck.com.

6 thoughts on “Indications that shot location data is flawed – Depends on where games are being played”