The article below is written by Chris Tremblay from ImPCT Sport. Make sure you’re following them on Twitter @ImpctSport. They’ve created a player evaluation model based on machine learning, and here’s a short introduction to the model. More to come from ImPCT Sport in the future.
Player profiles using the ImPCT engine
Assessing player’s entire contribution to winning or losing a game is of much discussion for professional sport fans and organizations alike. Fans debate over the better players, sport organizations invest millions in player assessment and players themselves thrive to improve and give ever better performances. In the advent of Artificial Intelligence and the recent advancements in data mining and tracking, computer systems can analyze a growing number of data faster and more accurately than any human being ever could. In the present, we wish to present the basics of the ImPCT enigne, a machine learning based algorithm, and how to interpret the outputted metrics.
Shallow dive into Deep Learning modeling
Deep learning models are artificial neural network (ANN) based. ANN models have been around for decades since neuro-physiologists McCulloch and Pitts first developed the idea of interconnected electrical circuits to simulate brain functions. In fact, ANNs were literally developed as models of how neurons interconnect in the human brain and operate to generate intelligent behaviour. Nowadays, ANNs are used for a large array of tasks including Speech recognition, computer vision, automated processing among others. The standard architecture is presented hereunder where an input layer and output layer are interconnected using series of interconnected processing layers:

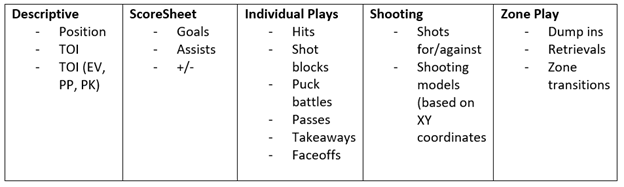
In the above example, I presented examples of Hockey related variables used to predict game outcomes. However, proper simulations use hundreds of variables, and thousands of interconnections to process game data. Hidden layers are used to extract features from datasets and perform multi-level analysis. For a fun summary of the inner workings of neural networks, tied with a fantastic sport application, I refer to this video by Mark Robber: https://www.youtube.com/watch?v=PmlRbfSavbI&t=657s
For a further dive into ANNs and how their use can compare to other mathematical tools such as the regression, I refer to a document I built during my University years available at this address: https://drive.google.com/file/d/1i5NBL-orC04-Y2X5IrIJH_UgZKnO2xq8/view?usp=sharing
Now what variables does the engine exactly use? The answer depends on the variables available. In fact, the engine will process any number of variables it is fed with, and will “learn” solutions based on the variables it is fed. To contextualise more on the work possible, here are some variables that have been successfully used by our team.
Player assessment profiles
Following a learning phase, where the ANN encodes the relationship between the game data variables (input layer) and the game outcome (output layer) using historical game data, the network can process new game data and provide valuable insights into player performance. Using our current player profiles, we will present some of the metrics provided.
Player Value
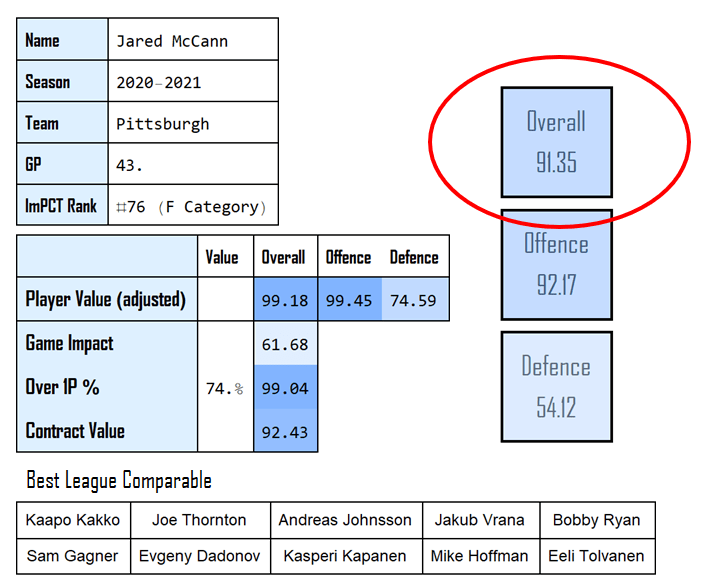
First and foremost is the Overall Value of the player, presented in the large squares to the right of the profile and circled hereunder:
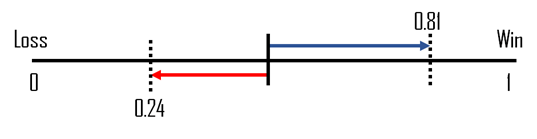
Once the network is presented with new sequences of data, the algorithm doesn’t literally predict a game win or loss. In fact, most networks are built to give such binary answers, however in the network used, a real value between 0 and 1 is outputted and representative of the quality of the prediction given by the network. We schematized the prediction making process hereunder where the network can provide positive predictions (Blue arrow) or negative predictions (Red arrow).
The player value score is hence the average of the quality of performances predicted. The values presented in the player cards are always expressed in percentiles of the empirical distribution of the entire dataset. As was shown, the process is below ideal since the process skews the real distribution of the scores, and some player differences are overestimated or underestimated based on the percentile. Real values are always available in full reports. However, percentiles help with interpretability as they indicate the proportion players playing at a sub-level. For instance, at a percentile of 91.35, Jared McCann played better than 91.35% of players in the previous season.
In summary, the Player Value metric is the engine’s evaluation of the entire value added by the player (Good and bad) to winning or losing a game.
Player Impact
In hockey, much like in most other team sports, players are used in different situations, and some play more, or play at positions that are more impactful than others. Hence our game impact metric circled hereunder:

For example, on a hockey roster, a simplified way to exemplify the game impact is the “line” players play on. Roughly speaking, 1st line forwards have a bigger impact on game outcome than the 2nd line forwards, who have a bigger impact than the 3rd line forwards and so on. Same is true on defence using pairings. However, different teams deploy their lines differently, hence not all 1st line forwards in the league have the same “Game Impact”. Using our algorithm, we measure player’s impacts by their average predictivity power. To exemplify this, the difference in predictivity power between Nick Paul (labeled as a 3rd line forward) and Connor McDavid (highest impact player in the league) is shown hereunder:
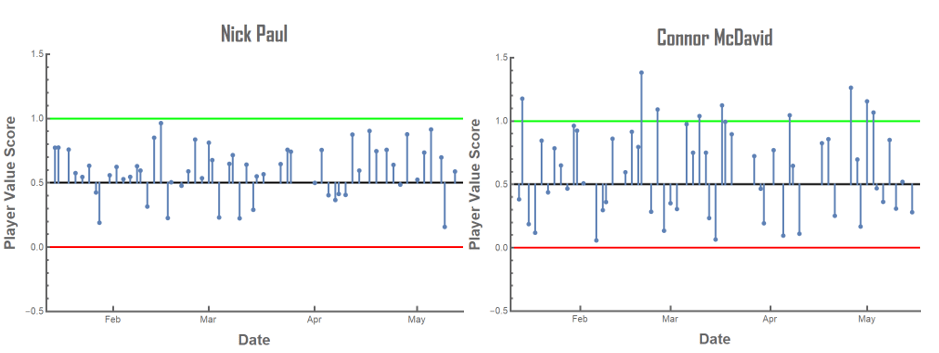
Both plots show the predictions made by the network, between 0 and 1, over the course of a hockey season. As is shown, Connor McDavid’s predictions hold more power in comparison to Nick Paul; The predictions tend to be closer to the 1 or 0 (W or L), and even reach those thresholds at times. This predictability power is what we qualify as “Game Impact”. Once presented in percentiles, a game impact value between 0 and 25 roughly translates to a 4th line player, 25 to 50 a 3rd line, 50 to 75 a 2nd and over 75 is a 1st line player. Same is true with the defensive pairings.
In summary, the Game Impact metric is the predictivity power of the player based on the role he occupies. Player with higher game impacts hold higher power to predict a game Win or Loss.
Player Value (Adjusted)
With more power comes increased responsibilities. This is what we attempt to measure with the Adj. Player value score. Shown hereunder:
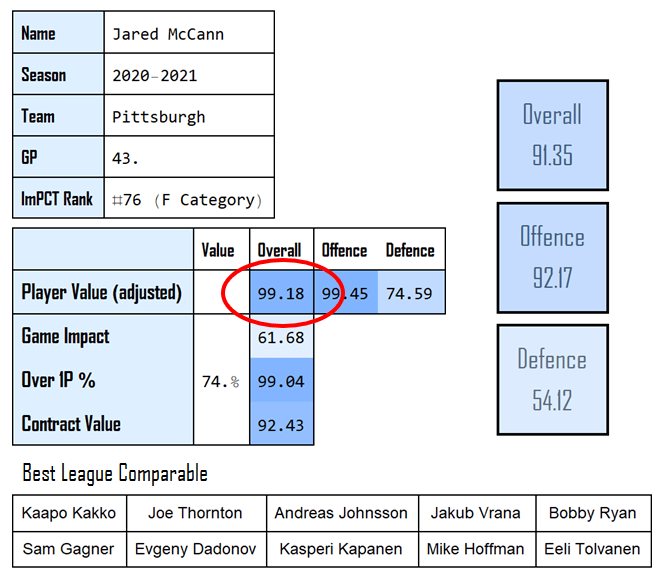
To have team success, your more impactful players need to provide with increasingly better performances. In other words, as a player move up the roster depth chart and gets more TOI, the same player must provide with better performances to expect team success.
The Adjusted Player Value score presents the value of the player, given the expectations present at his Game Impact level. The value of the player is hence adjusted based on the performance necessary to expect team success at the different deployment levels (Measured by Game Impact). It is not the current objective to dive into the adjustment process, however the case of Jared McCann provides a good example of its usefulness. At the 91.35th overall player value percentile, Jared McCann played extremely well this past season. Furthermore, playing behind the Crosby-Guentzel line, McCann carried a Game Impact level in the 61.68th percentile (2nd line forward). Given his great performance, and the reduced responsibilities associated with a second line forward (as opposed to 1st), Jared McCann’s adjusted score is even greater than his overall value at 99.18th percentile.
In Summary, the Player Value (adj.) metric presents the value of the player adjusted for the expectations at his deployment level (measured by Game Impact).
Over 1P%
The Over 1P% is the metric we use the measure consistency and is circled hereunder on our player profile template:
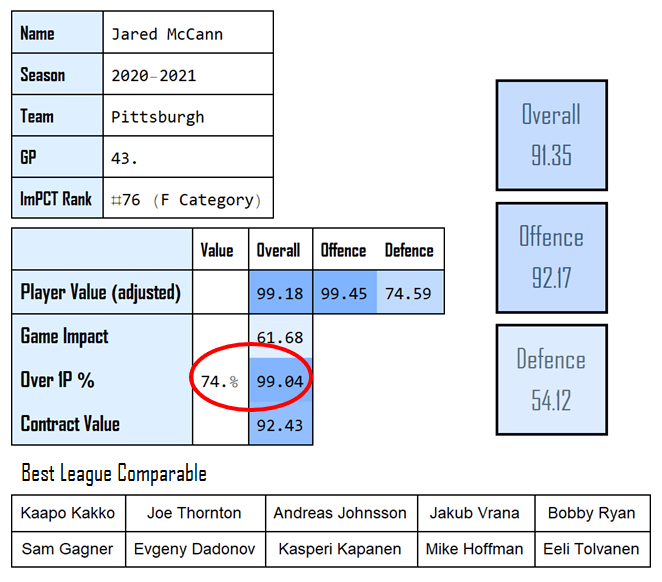
In the case of team sports, what is referred as a consistent player is usually a player that consistently provides positive performances, independently to whether those performances are very good or not. This does not correspond to the statistical concept of consistency, or a low spread (Standard Deviation) inside a dataset. For this reason, to quantify consistency, we simply calculate the ratio of Games played where the predicted outcome is over a specific threshold qualified as positive. The threshold chosen is set as the Player Value Score associated with an Overtime loss (or 1 Game point accumulated), and hence may differ from league to league. The NHL threshold calculated (Orange line) is shown hereunder with the case of Jared McCann:
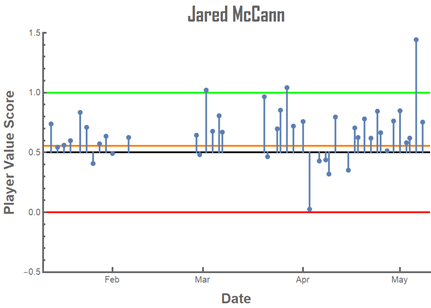
We chose the case of Jared McCann because he led the entire league in Over 1P% score. Although Jared McCann’s predictability power (Game Impact) was not close to top players like Connor McDavid, 74% of his games played predicted at least an Overtime Loss or better.
In summary, the Over 1P% is a measure of consistency, and presents the % of played games at a predicted OT loss or better.
Conclusion
There is much more to discuss about this application of deep learning to player assessments including nonlinearity, activation functions, factorisation using offensive ad defensive metrics, contract value estimations, Game Impact adjustments and feature extraction among others. The present serves only to show a basic understanding of deep learning models that already play a major role in sport modeling, and are sure to dominate the hockey modeling landscape in the near future.
Furthermore, here is a summary of the four metrics presented in this presentation:
- Overall value: Total evaluation of the value added by a player (Good and bad) to winning or losing a game.
- Game impact: Description of the deployment level of the player.
- Player value adjusted: Value of the player adjusted for the expectations at his deployment level (measured by Game Impact)
- Over 1P%: Percentage of game played predicting a team Overtime Loss or a Win.

2 thoughts on “Deep Learning Modeling of Hockey Game Contribution”