Here’s my first season projections. The plan is to do an analysis of each division in greater detail, but there are still a few changes I would like to make. I will get back to that later.
Updated data:
Before we get started, its important to note that I have updated the data behind the model. http://www.Evolving-Hockey.com have updated their GAR and xGAR models, so I have likewise updated my sGAA model with this new data input. The changes are fairly small, so I won’t go into detail in this article.
I have decided not to make the sGAA model available for download, since it may be a copyright violation. The sGAA model differs somewhat from Evolving-Hockey’s models, but it’s still close enough that I’ve decided not to make it downloadable. Better safe than sorry.
I’ve also updated the Arena Effect (Rink bias). Previously, I assumed the Arena Effect away from home was 0 (you can read about it here and here). This is a pretty good assumption, but there are some differences depending on your team’s division and conference. So, I have differentiated between Arena Effect home and Arena Effect away. This change has a limited effect on skaters, but it does affect goaltenders somewhat (especially in the shortened 12-13 season).
The updated Arena Effect can be downloaded here.
Performance Charts and Team Charts:
Team sGAA can still be downloaded, and I’ve set up the workbook, so you can easily make/find charts. I’m no computer expert, so I don’t know how to make the charts directly available on the site. Therefore, you’ll have to download this file for now: sGAA charts.
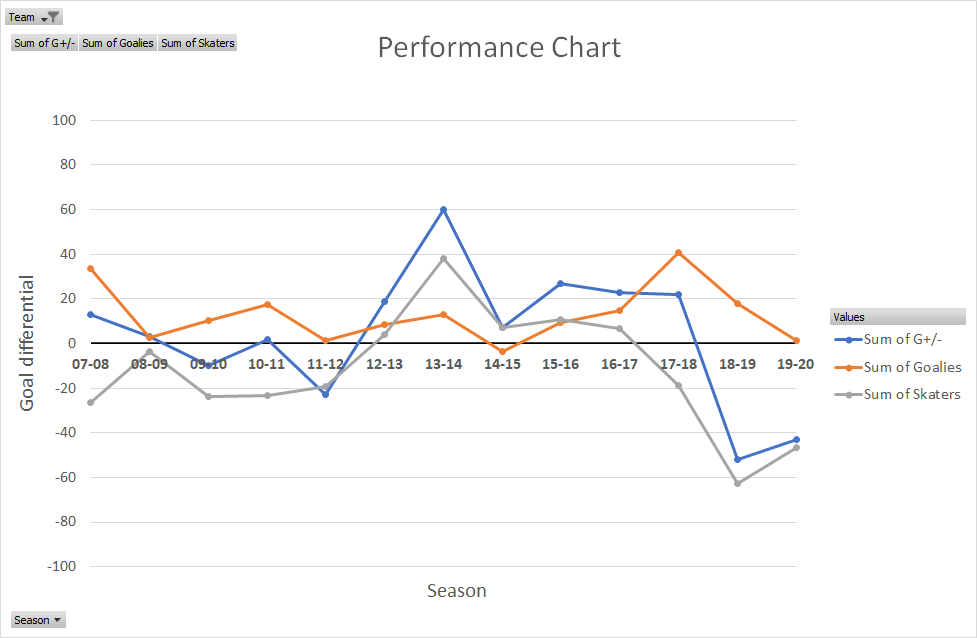
Here’s an example of a performance chart. This is Anaheim. The blue line is the goal differential of the team, while the orange and grey lines are the sGAA of the goalies and skaters respectively.
Team charts, where you can see performance in greater detail, can also be found in the workbook. Here’s an example of the Philadelphia 19/20 team. The chart shows the sGAA of each component plus the actual goal differential.

Feel free to use these charts as you like. Unfortunately, you will have to download the workbook for now. I hope to make the charts directly available on the site at some point.
The projection model:
On to the actual projection model. The process is pretty much the same as described in earlier posts (Link1, Link2 and Link3).
I have recalculated the p-sGAA (projected goal differential) with the updated data input. The complete data can be downloaded here. I have also converted the p-sGAA into Win%, so that I can make game projections and add game effects like strength of opposition, home ice and back-to-back games (newly added). You can read about the conversion here, and if you’re very nerdy the calculations behind the 20/21 projections can be found in this workbook.
The team projections are based on 20 skaters and 2 goalies, and I’ve picked the players based on pTOI (ice time from the previous 3 seasons). Eventually, I will probably use the official roster plus taxi squad. I’ve found the players via www.capfriendly.com.
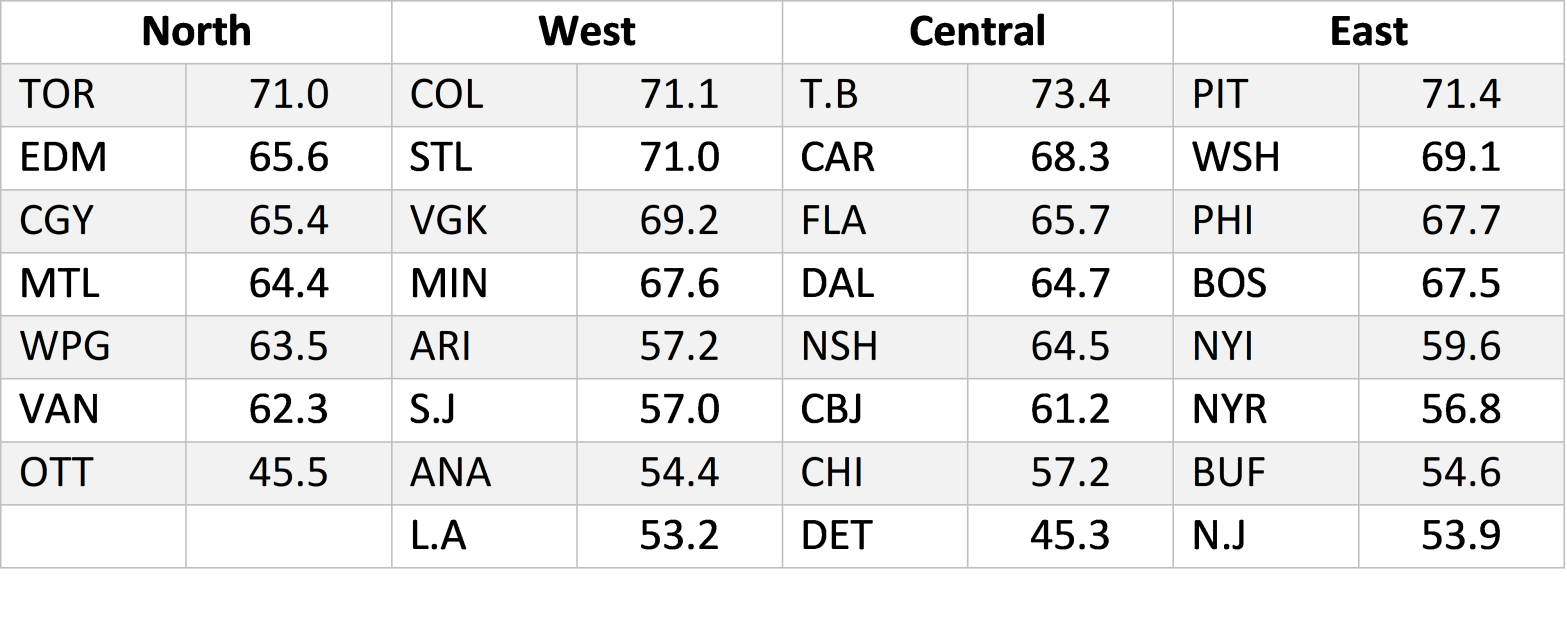
Here’s the 20/21 point projections:
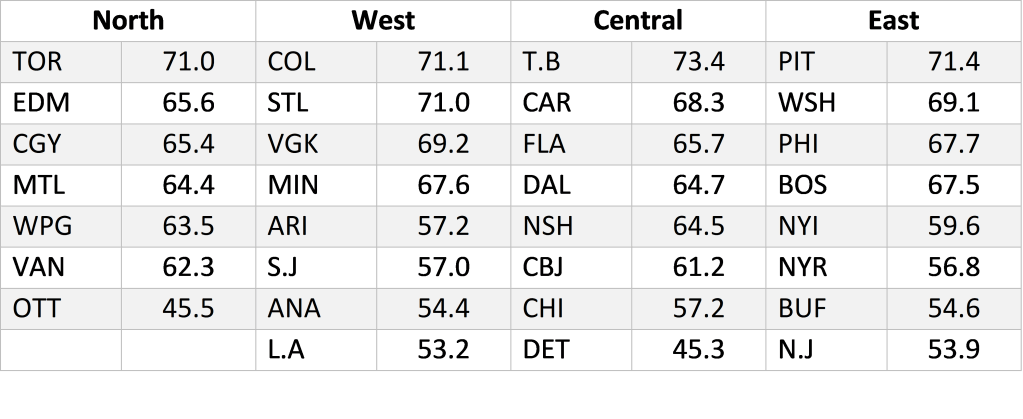
As mentioned earlier, I hope to do a more in-depth analysis of the projections. I will just say that I’m a bit surprised by the Pittsburgh Penguins projection. My model has never projected Pittsburgh to be stronger. Here’s a graph of Pittsburgh’s projection versus the actual results over the years. The blue line is the actual goal differential (result) and the orange line is the p-sGAA (projection).

These charts can be downloaded here
Perspective:
With the season just 9 days away, I have to admit that time is a limiting factor. One important tweak I need to make is to differentiate between defenders and forwards. Right now the age and experience adjustments are based on all skaters combined, but forwards probably declines at an earlier age than defenders, and defenders definitely play more than forwards.
Other than that the plan is to make game projections throughout the year. The game projections will be similar to the season projections, except they will be based on the actual line ups and there will be ELO adjustments.
Data from www.Evolving-Hockey.com and www.capfriendly.com

One thought on “Season Projections – First draft”