
Abstract:
The goal in this article is to convert my projection model (Read more here and here) from season projections into game projections.
From season projections to game projections:
The model as it stands right now uses p-sGAA to project team strength. I want to convert that into Win%, which is the projected number of wins over the course of a season. I’m not counting overtime or shootout losses, so per definition the average Win% across the league has to be 0.500.
So, the Win% will simply be defined like this:
Win% = 0.5 + p-sGAA*x
We don’t yet know what x is. Also, teams playing at home will have their Win% multiplied by 1.085 while teams on the road will have their Win% multiplied by 0.915.
With this in mind we can now find the Win probability for each team in each game:
Win probability = Win%/(Win%+Win%(opposition)
So, if a 0.550 team plays at home against a 0.500 team the win probability will be:
Win probability = (0.550*1.085)/(0.550*1.085+0.500*0.915) = 56.6%
We can then convert this into a projected point total, since we know the average game in the last 4 seasons is worth 2.228 points due to “loser points”. So:
pPoints = Win probability * 2.228 = 0.566*2.228 = 1.26 point
Finally, we can determine x. The point projections found via Win% should be equal to the point projections found in previous articles, since the input (p-sGAA) is the same. The best correlation between the two projection methods is when x equal 0.0036. Here’s the graph with data from the past 4 seasons:
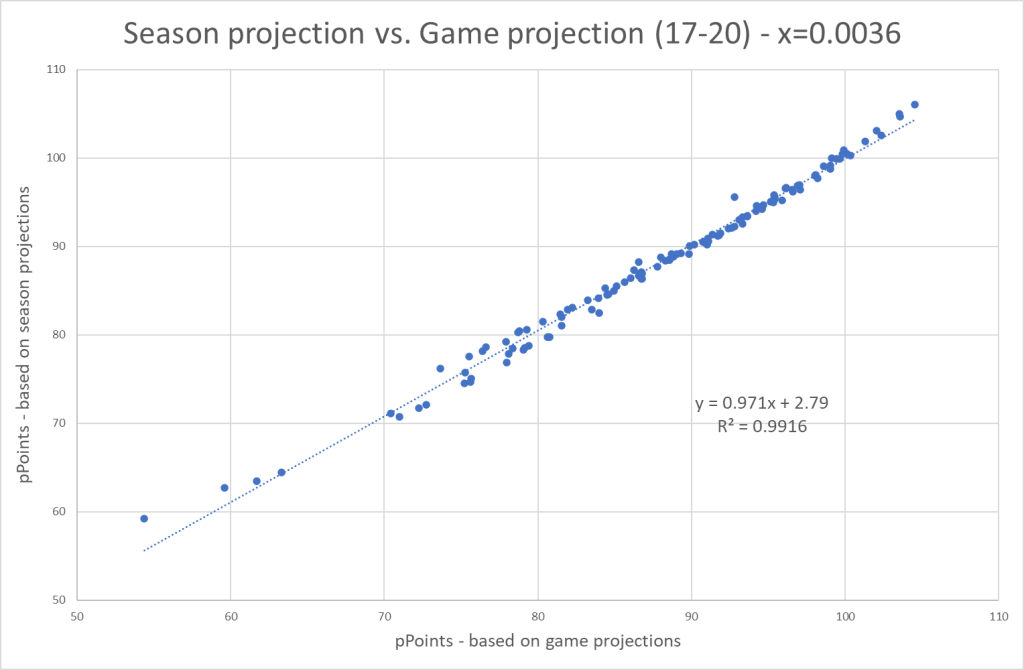
That’s a really good correlation, but why isn’t it perfect? There are two primary reasons why we see a slight difference:
- Strength of competition: The strength of the divisions/conferences can differ a bit, and the previous model didn’t account for this. It’s not a huge factor though.
- Number of home games in the 19/20 season: Since the 19/20 season was cut short teams had a different amount of home games, and that should affect the point projection a bit.
Overall, there’s no real difference between pPoints calculated through Win% or pPoints calculated directly via p-sGAA (projected goal differential). But using Win% adds some future perspectives.
Game probabilities:
This method gives us the possibility to look at single game projections. Remember that the following is based solely on preseason information. It doesn’t account for the actual lineups, so injuries and trades are not part of the projections. In season performance is also not accounted for, so the projected strength of a team isn’t affected by the results during the season.
Clearly, a game projection model has to account for these things, but in this article I’m just using preseason data.
With that in mind let’s take a deeper look at the game projections. Below are the calculated game probabilities versus the actual results from each of the past 4 seasons:
16/17:
| Probability | GP | Wins | Result |
|---|---|---|---|
| 65+ | 15 | 11 | 73.3 |
| 60-65 | 153 | 108 | 70.6 |
| 55-60 | 435 | 262 | 60.2 |
| 50-55 | 627 | 320 | 51.0 |
| Total | 1230 | 701 | 57.0 |
17/18:
| Probability | GP | Wins | Result |
|---|---|---|---|
| 65+ | 8 | 4 | 50.0 |
| 60-65 | 117 | 79 | 67.5 |
| 55-60 | 446 | 265 | 59.4 |
| 50-55 | 700 | 371 | 53.0 |
| Total | 1271 | 719 | 56.6 |
18/19:
| Probability | GP | Wins | Result |
|---|---|---|---|
| 65+ | 34 | 21 | 61.8 |
| 60-65 | 164 | 109 | 66.5 |
| 55-60 | 451 | 275 | 61.0 |
| 50-55 | 622 | 338 | 54.3 |
| Total | 1271 | 743 | 58.5 |
19/20:
| Probability | GP | Wins | Result |
|---|---|---|---|
| 70+ | 19 | 18 | 94.7 |
| 65-70 | 73 | 59 | 80.8 |
| 60-65 | 168 | 104 | 61.9 |
| 55-60 | 351 | 181 | 51.6 |
| 50-55 | 471 | 254 | 53.9 |
| Total | 1082 | 616 | 56.9 |
From 16/17 to 19/20:
| Probability | GP | Wins | Result |
|---|---|---|---|
| 70+ | 19 | 18 | 94.7 |
| 65-70 | 130 | 95 | 73.1 |
| 60-65 | 602 | 400 | 66.4 |
| 55-60 | 1683 | 983 | 58.4 |
| 50-55 | 2420 | 1283 | 53.0 |
| Total | 4854 | 2779 | 57.3 |
In total the favorite won 57.3 percent of the time. When we look at the combined results from all 4 seasons, we see a pretty good correlation between probability and result. The model is probably a bit too conservative though. Meaning the favorite wins more often than projected.
Perspective:
Honestly, this article isn’t particularly interesting in itself. It’s just a different way to showcase the model from earlier. However, it lays the groundwork for future work. When the new season starts (knocks on wood), I want to have season projections ready, but I also want to make game projections during the season.
Next step from here, is to develop the game projection model, so I have to find line ups for the past games, so I can calculate Win% for each game. This is a bit more complicated than the above process, but it should be doable.

2 thoughts on “Converting season projections to game Projections”