Abstract:
The goal here is to compare my projection model (read more here and here) to other models out there. All of my projections below are made well after the games were played, so the true test of the model will be its performance this upcoming season.
The model is the same for all ten seasons (from 10/11 to 19/20) and it’s based solely on data from the previous 3 seasons. I have refined the model to give the lowest average error and the correlation (R-squared).
I’m using Dom Luszcyszyn’s end of the year reviews to compare my model to its peers.
16/17:
Let’s start off by looking at the 2016/2017 season. Here’s how other predictions went that season. The picture is taken from Dom Luszcyszyn’s prediction review which can be found here.

And here’s how my model would have projected the season:
| Team | Season | pPoints | Points | Difference |
|---|---|---|---|---|
| ANA | 16-17 | 88.82 | 105 | 16.18 |
| ARI | 16-17 | 86.97 | 70 | 16.97 |
| BOS | 16-17 | 96.22 | 95 | 1.22 |
| BUF | 16-17 | 79.24 | 78 | 1.24 |
| CAR | 16-17 | 81.50 | 87 | 5.50 |
| CBJ | 16-17 | 91.31 | 108 | 16.69 |
| CGY | 16-17 | 93.39 | 94 | 0.61 |
| CHI | 16-17 | 93.33 | 109 | 15.67 |
| COL | 16-17 | 86.41 | 48 | 38.41 |
| DAL | 16-17 | 87.11 | 79 | 8.11 |
| DET | 16-17 | 85.02 | 79 | 6.02 |
| EDM | 16-17 | 89.19 | 103 | 13.81 |
| FLA | 16-17 | 95.21 | 81 | 14.21 |
| L.A | 16-17 | 93.04 | 86 | 7.04 |
| MIN | 16-17 | 94.33 | 106 | 11.67 |
| MTL | 16-17 | 92.58 | 103 | 10.42 |
| N.J | 16-17 | 83.95 | 70 | 13.95 |
| NSH | 16-17 | 103.07 | 94 | 9.07 |
| NYI | 16-17 | 93.97 | 94 | 0.03 |
| NYR | 16-17 | 95.33 | 102 | 6.67 |
| OTT | 16-17 | 89.14 | 98 | 8.86 |
| PHI | 16-17 | 91.30 | 88 | 3.30 |
| PIT | 16-17 | 101.84 | 111 | 9.16 |
| S.J | 16-17 | 104.68 | 99 | 5.68 |
| STL | 16-17 | 95.57 | 99 | 3.43 |
| T.B | 16-17 | 98.78 | 94 | 4.78 |
| TOR | 16-17 | 77.57 | 95 | 17.43 |
| VAN | 16-17 | 82.87 | 69 | 13.87 |
| WPG | 16-17 | 90.19 | 87 | 3.19 |
| WSH | 16-17 | 106.07 | 118 | 11.93 |
| Overall | 16-17 | 9.84 |
The one team that jumps at you right away is Colorado. They ended up with just 48 points which was historically bad. I don’t think anyone could have foreseen that kind of season. Dom’s model was off by 37 points on Colorado.
Other than Colorado the model did okay, and it would have been the best prediction out there. Obviously, there’s no fame and glory in predicting results 4 years after they happened.
17/18:
The following season would turn out to be the toughest to predict. Here’s how the other models performed, and Dom’s review can be found here, if you have a subscription to The Athletic.

Here’s how my model would have done. It would have been the second-best prediction, but way behind Cosica’s prediction.
| Team | Season | pPoints | Points | Difference |
|---|---|---|---|---|
| ANA | 17-18 | 90.59 | 101 | 10.41 |
| ARI | 17-18 | 86.51 | 70 | 16.51 |
| BOS | 17-18 | 95.05 | 112 | 16.95 |
| BUF | 17-18 | 83.10 | 62 | 21.10 |
| CAR | 17-18 | 96.62 | 83 | 13.62 |
| CBJ | 17-18 | 95.80 | 97 | 1.20 |
| CGY | 17-18 | 92.11 | 84 | 8.11 |
| CHI | 17-18 | 86.92 | 76 | 10.92 |
| COL | 17-18 | 80.30 | 95 | 14.70 |
| DAL | 17-18 | 92.02 | 92 | 0.02 |
| DET | 17-18 | 85.51 | 73 | 12.51 |
| EDM | 17-18 | 92.27 | 78 | 14.27 |
| FLA | 17-18 | 85.97 | 96 | 10.03 |
| L.A | 17-18 | 90.45 | 98 | 7.55 |
| MIN | 17-18 | 100.54 | 101 | 0.46 |
| MTL | 17-18 | 93.46 | 71 | 22.46 |
| N.J | 17-18 | 85.28 | 97 | 11.72 |
| NSH | 17-18 | 99.92 | 117 | 17.08 |
| NYI | 17-18 | 96.58 | 80 | 16.58 |
| NYR | 17-18 | 94.58 | 77 | 17.58 |
| OTT | 17-18 | 88.60 | 67 | 21.60 |
| PHI | 17-18 | 89.12 | 98 | 8.88 |
| PIT | 17-18 | 100.89 | 100 | 0.89 |
| S.J | 17-18 | 100.26 | 100 | 0.26 |
| STL | 17-18 | 91.50 | 94 | 2.50 |
| T.B | 17-18 | 95.13 | 113 | 17.87 |
| TOR | 17-18 | 90.92 | 105 | 14.08 |
| VAN | 17-18 | 78.59 | 73 | 5.59 |
| VGK | 17-18 | 84.14 | 109 | 24.86 |
| WPG | 17-18 | 96.90 | 114 | 17.10 |
| WSH | 17-18 | 99.99 | 105 | 5.01 |
| Overall | 17-18 | 11.69 |
It’s probably fair to say that Vegas surprised everyone. My model would have been pretty high on them, but still way off. It’s also interesting that the model had no clear-cut contenders – MIN, NSH, PIT, S.J and WSH were all projected to get around 100 points.
In the end the model was wrong about most teams, but at least it was less wrong than most other predictions.
18/19:
The picture below here shows the performance of other predictions, and Dom’s review can be found here.

My projection model would have been first by a tiny margin. A lot of the predictions had an error around 8 points.
| Team | Season | pPoints | Points | Difference |
|---|---|---|---|---|
| ANA | 18-19 | 94.25 | 80 | 14.25 |
| ARI | 18-19 | 87.73 | 86 | 1.73 |
| BOS | 18-19 | 96.41 | 107 | 10.59 |
| BUF | 18-19 | 82.00 | 76 | 6.00 |
| CAR | 18-19 | 99.90 | 99 | 0.90 |
| CBJ | 18-19 | 99.16 | 98 | 1.16 |
| CGY | 18-19 | 91.23 | 107 | 15.77 |
| CHI | 18-19 | 80.47 | 84 | 3.53 |
| COL | 18-19 | 88.36 | 90 | 1.64 |
| DAL | 18-19 | 90.09 | 93 | 2.91 |
| DET | 18-19 | 76.20 | 74 | 2.20 |
| EDM | 18-19 | 90.53 | 79 | 11.53 |
| FLA | 18-19 | 90.24 | 86 | 4.24 |
| L.A | 18-19 | 86.70 | 71 | 15.70 |
| MIN | 18-19 | 99.06 | 83 | 16.06 |
| MTL | 18-19 | 86.32 | 96 | 9.68 |
| N.J | 18-19 | 88.44 | 72 | 16.44 |
| NSH | 18-19 | 105.00 | 100 | 5.00 |
| NYI | 18-19 | 86.64 | 103 | 16.36 |
| NYR | 18-19 | 82.35 | 78 | 4.35 |
| OTT | 18-19 | 78.15 | 64 | 14.15 |
| PHI | 18-19 | 96.93 | 82 | 14.93 |
| PIT | 18-19 | 98.11 | 100 | 1.89 |
| S.J | 18-19 | 98.02 | 101 | 2.98 |
| STL | 18-19 | 94.65 | 99 | 4.35 |
| T.B | 18-19 | 102.55 | 128 | 25.45 |
| TOR | 18-19 | 97.68 | 100 | 2.32 |
| VAN | 18-19 | 80.63 | 81 | 0.37 |
| VGK | 18-19 | 94.98 | 93 | 1.98 |
| WPG | 18-19 | 100.45 | 99 | 1.45 |
| WSH | 18-19 | 96.41 | 104 | 7.59 |
| Overall | 18-19 | 7.66 |
My model gave Tampa Bay the second highest point projection, but it was still way off. Calgary and NY Islanders were the two positive surprises. Overall the model did pretty good, but you would have liked it to be lower on Anaheim and higher on Boston, since that seemed predictable.
19/20:
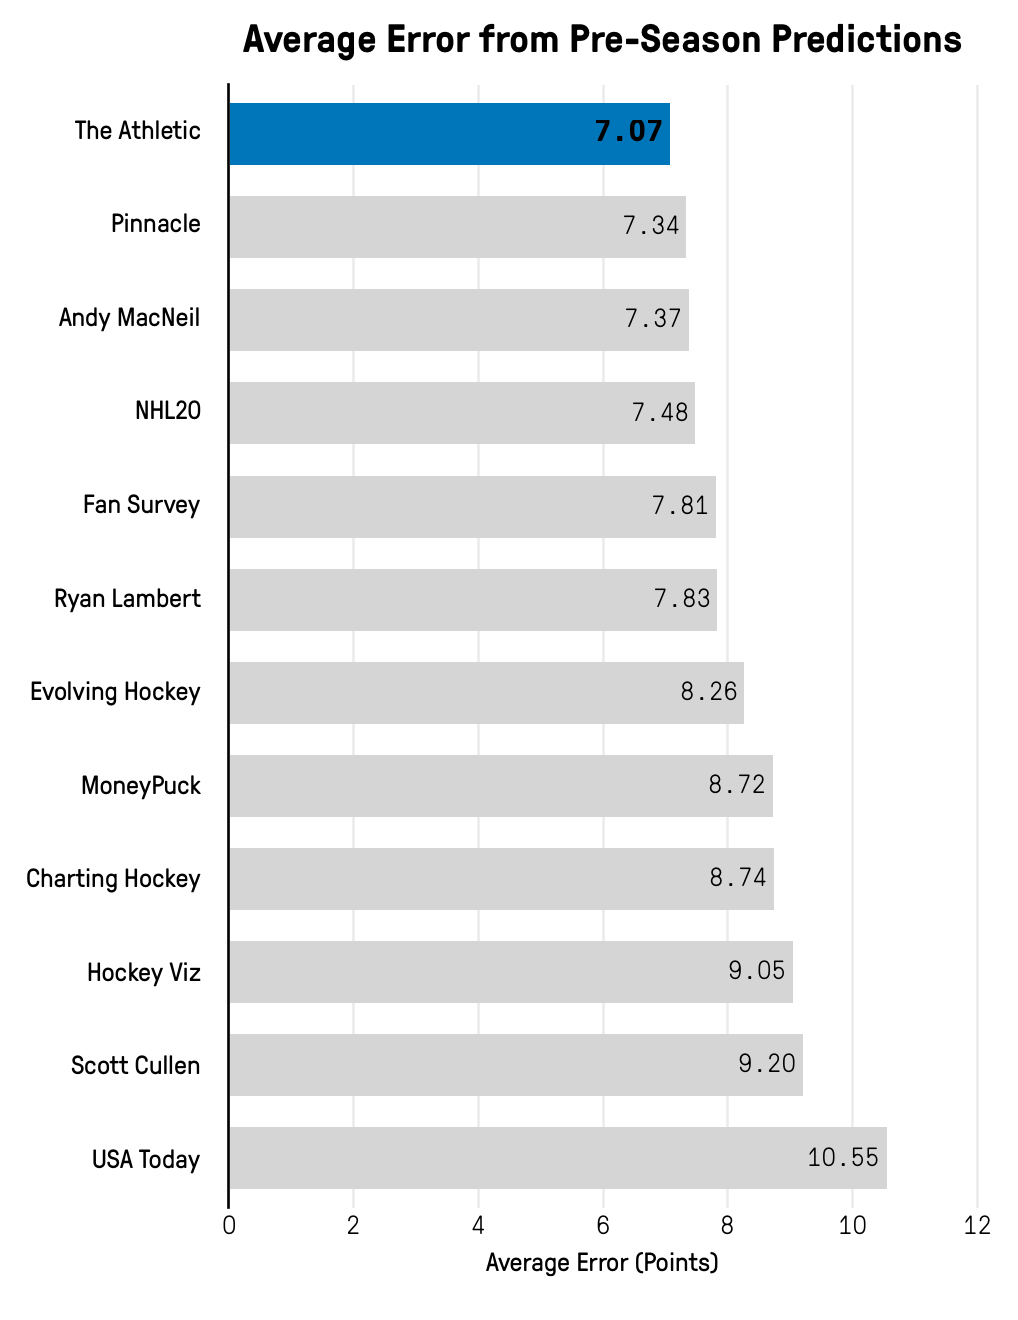
Let’s jump to the most current season. The review can be found here, if you have a subscription to the Athletic. All projections are prorated to 82 games.
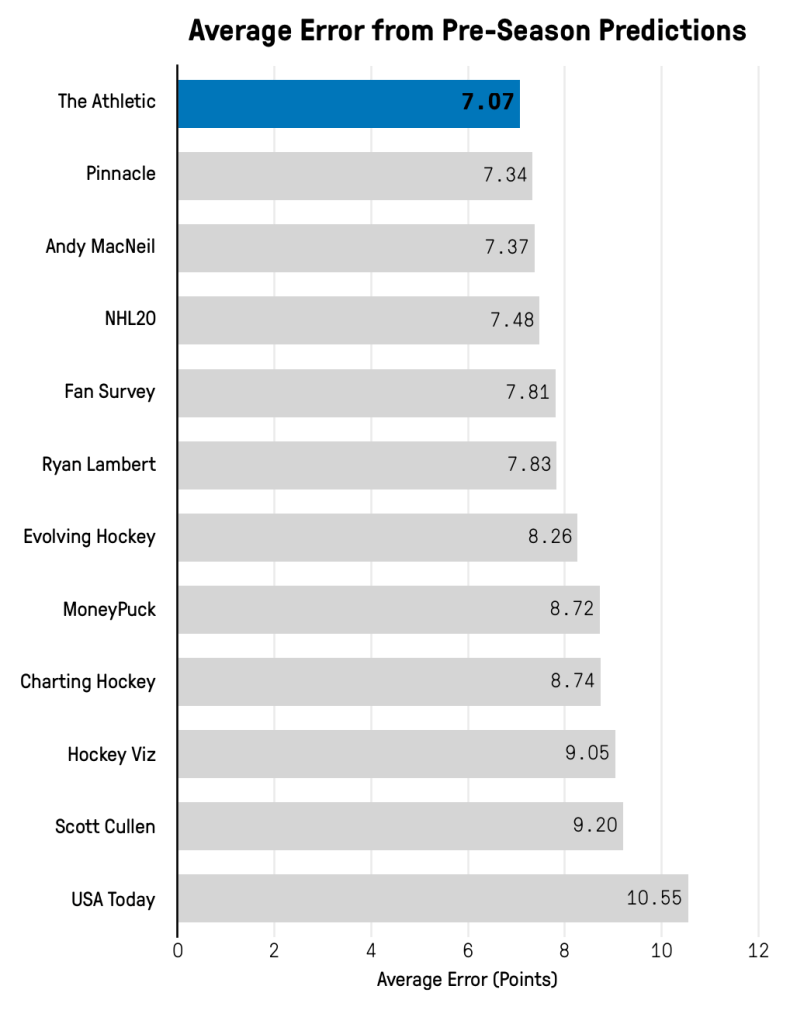
Again, my model would have been first and by a decent margin. Overall, it was a fairly predictable season and most of the predictions were quite good.
| Team | Season | GP | pPoints | Points | Difference |
|---|---|---|---|---|---|
| ANA | 19-20 | 71 | 86.70 | 77.38 | 9.32 |
| ARI | 19-20 | 70 | 83.33 | 86.69 | 3.36 |
| BOS | 19-20 | 70 | 97.09 | 117.14 | 20.05 |
| BUF | 19-20 | 69 | 76.57 | 80.81 | 4.24 |
| CAR | 19-20 | 68 | 105.29 | 97.68 | 7.62 |
| CBJ | 19-20 | 70 | 96.65 | 94.89 | 1.77 |
| CGY | 19-20 | 70 | 92.24 | 92.54 | 0.30 |
| CHI | 19-20 | 70 | 88.72 | 84.34 | 4.38 |
| COL | 19-20 | 70 | 91.24 | 107.77 | 16.53 |
| DAL | 19-20 | 69 | 93.29 | 97.45 | 4.16 |
| DET | 19-20 | 71 | 68.37 | 45.04 | 23.33 |
| EDM | 19-20 | 71 | 92.13 | 95.86 | 3.73 |
| FLA | 19-20 | 69 | 100.45 | 92.70 | 7.76 |
| L.A | 19-20 | 70 | 75.58 | 74.97 | 0.61 |
| MIN | 19-20 | 69 | 93.04 | 91.51 | 1.53 |
| MTL | 19-20 | 71 | 86.08 | 82.00 | 4.08 |
| N.J | 19-20 | 69 | 88.71 | 80.81 | 7.90 |
| NSH | 19-20 | 69 | 100.56 | 92.70 | 7.86 |
| NYI | 19-20 | 68 | 86.46 | 96.47 | 10.01 |
| NYR | 19-20 | 70 | 82.90 | 92.54 | 9.64 |
| OTT | 19-20 | 71 | 73.27 | 71.61 | 1.67 |
| PHI | 19-20 | 69 | 93.38 | 105.77 | 12.39 |
| PIT | 19-20 | 69 | 96.28 | 102.20 | 5.92 |
| S.J | 19-20 | 70 | 90.08 | 73.80 | 16.28 |
| STL | 19-20 | 71 | 102.52 | 108.56 | 6.04 |
| T.B | 19-20 | 70 | 111.93 | 107.77 | 4.16 |
| TOR | 19-20 | 70 | 104.44 | 94.89 | 9.56 |
| VAN | 19-20 | 69 | 85.65 | 92.70 | 7.04 |
| VGK | 19-20 | 71 | 99.69 | 99.32 | 0.37 |
| WPG | 19-20 | 71 | 92.11 | 92.39 | 0.29 |
| WSH | 19-20 | 69 | 104.86 | 106.96 | 2.10 |
| Overall | 19-20 | 6.90 |
There were a few surprises though. San Jose being this bad probably came as a shock to most, and Detroit ended up 10 points below replacement level. I don’t think either team was this bad, but sometimes losses lead to more losses. It can be a vicious circle.
The model was too low on Colorado and Boston. Not just compared to the results, but also compared to consensus thinking. Most were bullish on Colorado before the start of the season – My model wasn’t.
Comparison with Dom’s model:
It’s also interesting to compare my projections with those from Dom’s model. The table below shows my projection (pPoints), Dom’s projection (Dom) and the difference between the two from the 2019/2020 season:
| Team | Points | pPoints | Dom | Difference |
|---|---|---|---|---|
| FLA | 92.7 | 100.5 | 91.6 | 8.9 |
| EDM | 95.9 | 92.1 | 83.9 | 8.2 |
| WSH | 107.0 | 104.9 | 96.9 | 8.0 |
| CBJ | 94.9 | 96.7 | 90.6 | 6.1 |
| CAR | 97.7 | 105.3 | 100.1 | 5.2 |
| WPG | 92.4 | 92.1 | 88.2 | 3.9 |
| T.B | 107.8 | 111.9 | 109.4 | 2.5 |
| PHI | 105.8 | 93.4 | 91.4 | 2.0 |
| OTT | 71.6 | 73.3 | 71.5 | 1.8 |
| STL | 108.6 | 102.5 | 100.8 | 1.7 |
| CHI | 84.3 | 88.7 | 87.1 | 1.6 |
| VAN | 92.7 | 85.7 | 84.6 | 1.1 |
| VGK | 99.3 | 99.7 | 99.5 | 0.2 |
| MIN | 91.5 | 93.0 | 92.9 | 0.1 |
| L.A | 75.0 | 75.6 | 75.5 | 0.1 |
| NSH | 92.7 | 100.6 | 101.1 | -0.5 |
| TOR | 94.9 | 104.4 | 105.6 | -1.2 |
| DAL | 97.4 | 93.3 | 95.6 | -2.3 |
| NYI | 96.5 | 86.5 | 89.1 | -2.6 |
| NYR | 92.5 | 82.9 | 85.6 | -2.7 |
| ARI | 86.7 | 83.3 | 86.2 | -2.9 |
| DET | 45.0 | 68.4 | 71.4 | -3.0 |
| PIT | 102.2 | 96.3 | 99.4 | -3.1 |
| COL | 107.8 | 91.2 | 94.4 | -3.2 |
| N.J | 80.8 | 88.7 | 92.0 | -3.3 |
| ANA | 77.4 | 86.7 | 90.0 | -3.3 |
| CGY | 92.5 | 92.2 | 96.1 | -3.9 |
| MTL | 82.0 | 86.1 | 90.1 | -4.0 |
| BUF | 80.8 | 76.6 | 81.1 | -4.5 |
| S.J | 73.8 | 90.1 | 95.2 | -5.1 |
| BOS | 117.1 | 97.1 | 104.1 | -7.0 |
| Average | 91.5 | 91.6 | 91.6 | 3.4 |
On average the two models are 3.4 points apart, so there is some difference. Some of that is probably because of goaltending. In my current model I expect goaltending to regress heavily towards average. For the most part it’s a good assumption, but it means that a team like Boston gets undervalued. They consistently get good/great goaltending, but the model expect them to regress every year.
Explaining the differences between the two models would require a very thorough analysis, so for now I will just leave it as it is.
Notes:
The observant reader might have noticed a difference between Dom’s projections in the previous article and this one. That’s because I used his projections from his team previews last time, but those were made well before the season started. The projections in this article are from opening night.
Conclusion:
The projection model seems to predict results quite well, but the true testimony of the model will come next season. It will be interesting to see, how well it predicts future results – both season results and single game results.
The model definitely still needs some work. I would like the goaltender projections to work better, so I could put more weight on them. I would also like to add an age curve to each player, so the age adjustment isn’t done on the team level.
I used articles from www.theathletic.com in this piece.

One thought on “Evaluating the projection model”