
I want to take a deeper look at the GAR and xGAR models from http://www.Evolving-Hockey.com. However, it’s very difficult to evaluate these models at the individual player level. There is no agreed upon way to measure the performance/impact of a player. You can look at points, on-ice goal differential, xG%, the eye test or any number of things. The GAR models try to estimate the impact of a player by factoring in a variety of stats. But we can’t really determine if the model is good or bad, since there is no agreed upon test.
In many ways, player evaluations are just subjective opinions. This is why, my approach is slightly different. I’m not going to discuss whether Valeri Nichushkin is better than Leon Draisaitl. Instead, I will focus on the team level. How well does the GAR and xGAR models describe team performances?
We know how to define a good team. Good teams outscore their opponents and win hockey games. It’s as simple as that. Therefore, I’m going to use goal differential to measure team performance. This gives us a stat that we can compare with team GAR/xGAR.
Just because team GAR correlates well with goal differential at the team level, doesn’t mean it’s necessarily a great descriptive model at the player level. A model can’t be great at the player level and bad at the team level, but it can be great at the team level and bad at the player level.
My first step is to simply look at the correlation between team GAR/xGAR and team goal differential. I’m looking at every season since 2007/2008, which gives us 393 data points (10 seasons with 30 teams and 3 seasons with 31 teams). The data is prorated to 82 games, so that I can use the data from the 2012/2013 and 2019/2020 seasons.
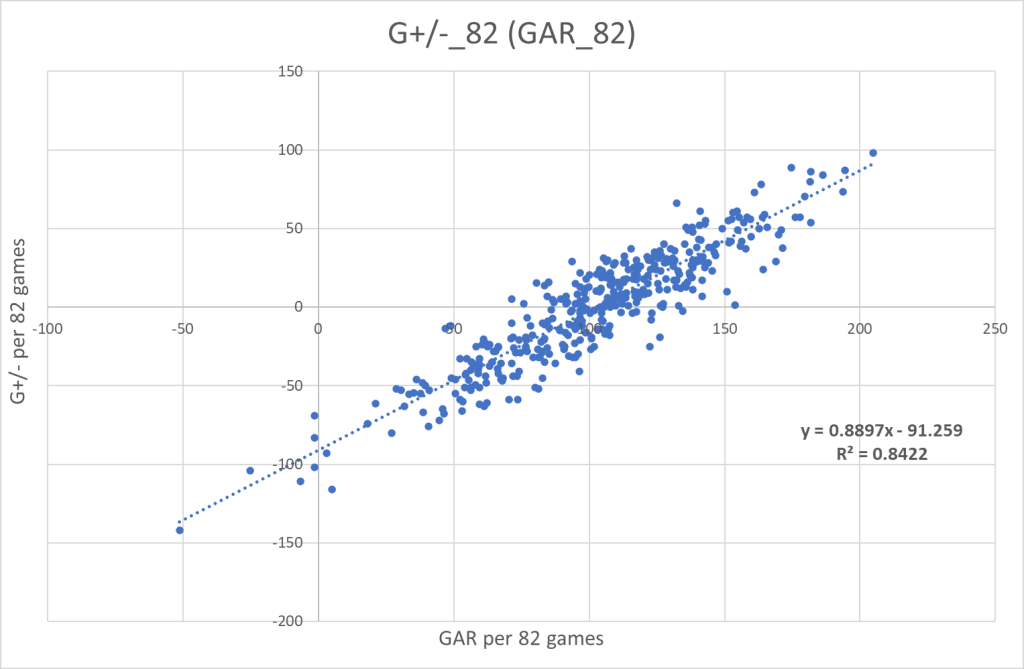
Let’s start by looking at the skaters only. Here’s team G+/- as a function of skater_GAR:

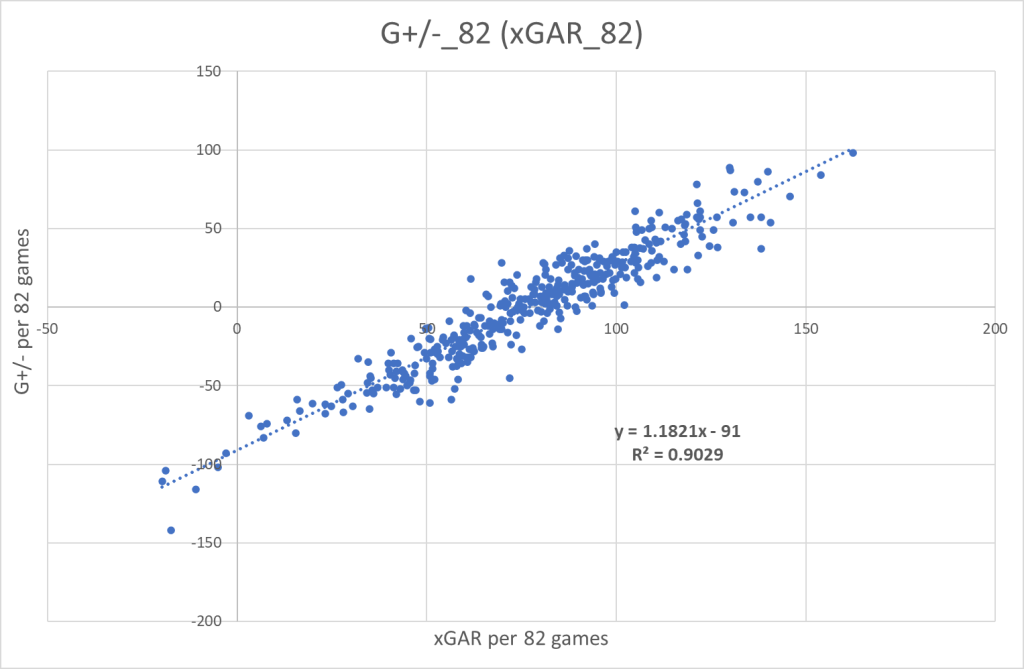
There’s obviously a decent correlation, but not exactly perfect. I have also looked at the xGAR model, and here’s that correlation:
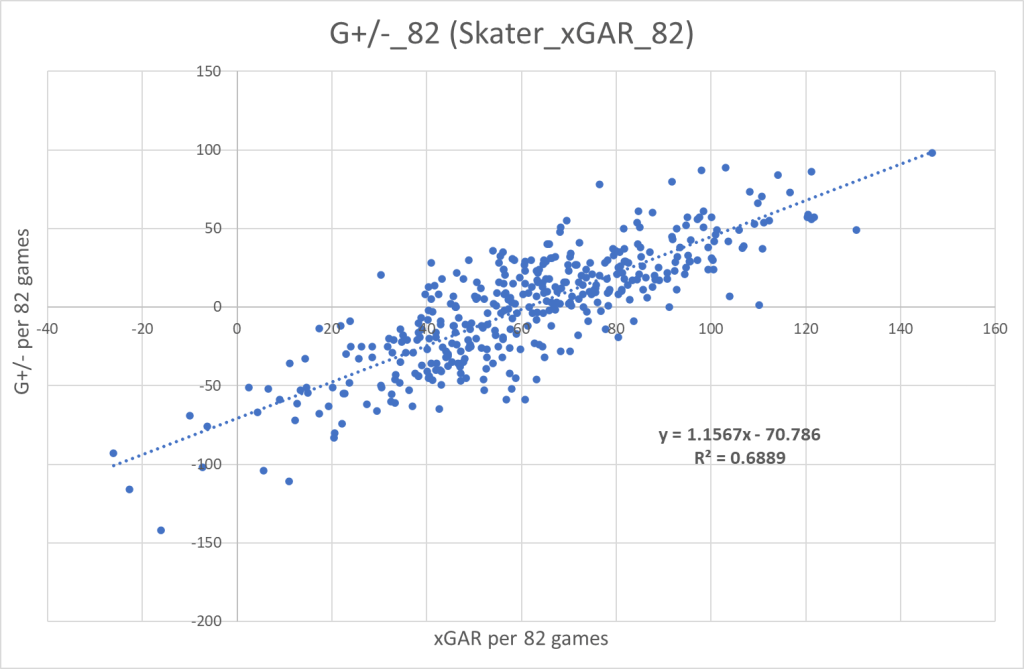
Surprisingly, xGAR describes team results better than GAR does. This is a bit surprising since GAR is supposed to be more of a descriptive model whereas xGAR is supposed to be more predictive in its nature. The difference is not huge, but it’s still interesting.
So, let’s add the goaltender GAR and see what happens:
With this addition the correlation in both models increases, but more in the xGAR model. In fact, the xGAR model already correlates really well with team performance. There are two things worth noting though:
- GK_GAR = GK_xGAR – There’s only one GAR stat for goaltending.
- GAR > xGAR – In general players have a larger GAR than xGAR.
This could indicate that GK_GAR is factored better for the xGAR model than the GAR model.
I also tried using GSAx (based on Evolving-hockey’s xG model) as my goaltender stat. That gave the following result:


Now, we see the GAR model being slightly better than the xGAR model. Part of this is clearly because of factoring. I won’t draw any conclusions yet, but I will address the factoring issue later on. Other than that, I will just leave the graphs as they are now.
Instead, I will try and redefine GAR and xGAR, so that I can compare them directly to goal differential, which is a zero-sum stat. The sum of the goal differentials for all NHL team will always be zero, so therefore I want to reform the GAR and xGAR models into zero-sum models. I’m going to call the models goals above average (GAA) and expected goals above average (xGAA), because that’s what they are. My GAA and xGAA are different than the ones you can find on Evolving-hockey.com though. So, be aware of that.
I have based the zero-sums on year, position and component. This means that the total sum of GAA/xGAA in a season is always zero, the total sum amongst forwards (for instance) is always zero and the total sum of PPO_GAA (for instance) is always zero. The calculations can be found here (Appendix 1).
This has some consequences on the player level, but overall I think the redefined models are better. In general forwards are ranked lower in the redefined models and defenders are conversely ranked higher. PP specialists are also ranked lower whereas PK specialists are ranked higher. I think, the GAR/xGAR models may be biased towards forwards and PP specialists.
With all the calculations out of the way, we can now compare the redefined models with team goal differential. Here’s the skaters only and since the model is now a zero-sum model like goal differential, I don’t have to prorate the data:
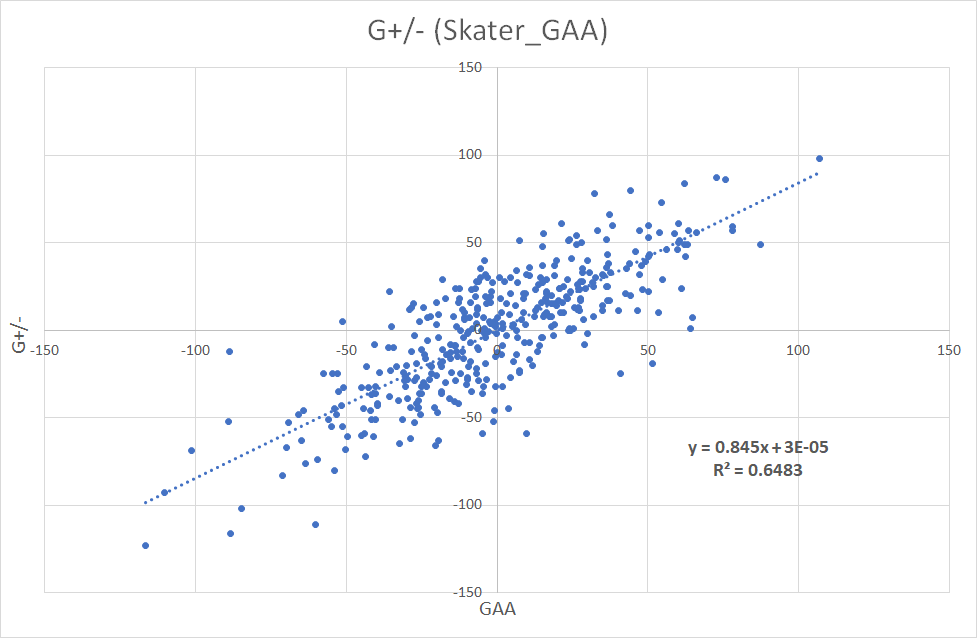

We see that Skater_GAA and Skater_xGAA correlates similarly well with goal differential as Skater_GAR_82 and Skater_xGAR_82 did. This isn’t surprising since the changes I’ve made primarily affects forwards vs defenders and PP specialists vs PK specialists, so as long as every team plays 3 forwards and 2 defenders 5v5, you wouldn’t expect a big difference.
Now, we can add the goaltending component – GK_GAA:


Exactly like we saw earlier, the goaltending component fits better with xGAA than with GAA. A big part of this, is due to factoring/weighing of the different components. I will therefore refine the graphs to optimize the correlation. In the process I make sure that 1 GAA/xGAA equals 1 actual goal.
For the GAA model I’ve made the following adjustments:

There’s a relatively big difference between the weight put on EVO and the weight put on EVD. Due to the zero-sum nature of the model, this means that the extreme cases of EVD (either really good or really bad defense) get rated closer to average. This is of course great for someone like Leon Draisaitl, who is elite offensively but really bad defensively. However, the process where we went from GAR to GAA was equally bad for him, since he’s a forward and a PP specialist. Going from GAR to GAA to GAA_adjusted Drasaitl’s league rank went from 23rd to 41st and back to 23rd.
In the end the GAA_adjusted rankings are pretty close to the original GAR rankings.
Anyway, here’s the graph:

When weighing the components accordingly, we end up with a pretty good correlation between GAA_adjusted and the goal differential.
I’ve also refined the xGAA model, and that gave the following adjustments:

Here the differences between the factors are smaller indicating, that the model was already pretty good. Theoretically, you would like the goaltending and penalty components to be factored equally in the two models since they are the same. This is pretty close though.
So, here’s the graph with the adjustments to xGAA:
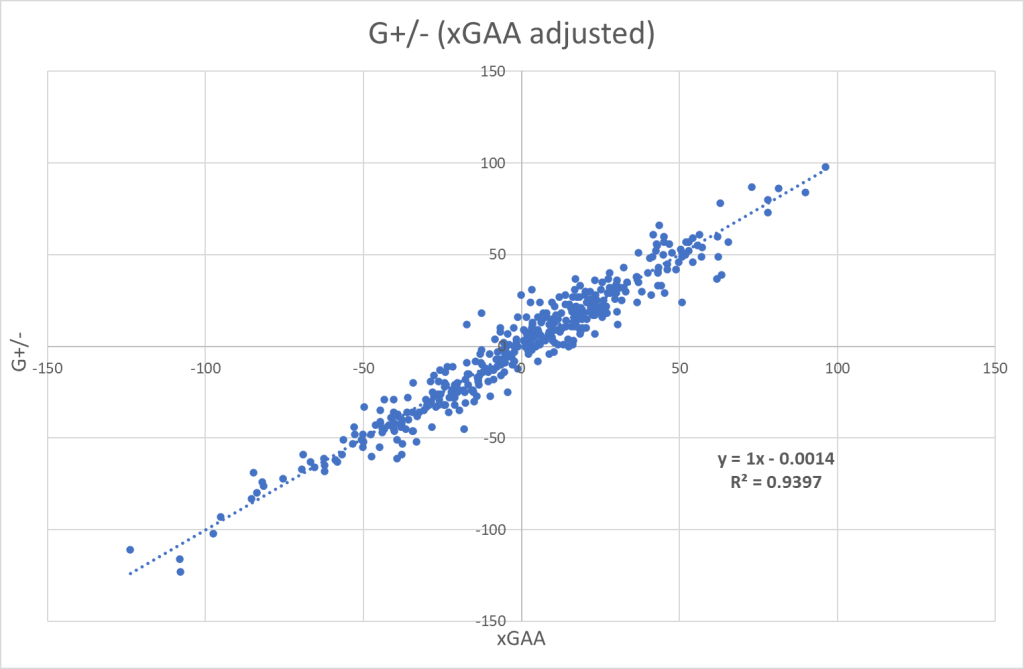
I would also like to see what happens if we use GSAx instead of GK_GAA. I’ve turned GSAx into a zero-sum model in accordance to the calculations in appendix 1. Here’s the adjusted results, when we use GSAx instead of GK_GAA:

When we go from GK_GAA to GSAx the weight put on the defensive components (EVD and SHD) increases and this is the case in both models. I think this indicates, that GK_GAA isolates goaltending from defense better than GSAx does. However, when we’re using GSAx the models correlate better with goal differential.
Here’s the GAA model with GSAx as the goaltending component:

And here’s the adjustments to xGAA model if we use GSAx:

Which result in the following graph:

Going forward I will be using GSAx as my goaltending component. I don’t necessarily think GSAx is a better stat than GK_GAA, but it fits better with the GAA and xGAA models.
Now, we have two models that can be compared directly, so what happens if we combine them? Here’s the combined model, which I have called sGAA:
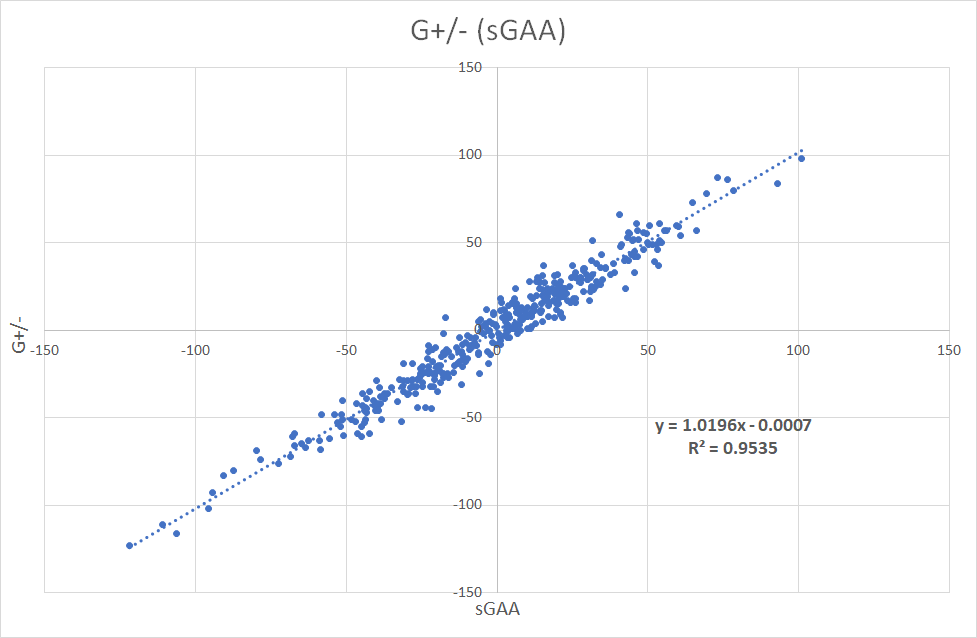
I won’t say much about the graph, but just conclude that the combined model correlates better with goal differential than the two models individually.
Discussion:
So, what was the purpose with this exercise? First of all, I wanted to make a descriptive model where you can see the impact of a player directly. If a player has a GAA of +4, he’s simply worth 4 goals more than the average player and he’s worth 4 goals to the goal differential of the team.
Secondly, I want the model to correlate directly to team performance, so that it can be used as the basis in a predictive model, that predicts future team results.
In the beginning of the article, I said that just because a model is good at the team level it’s not necessarily good for making player evaluations. I’ve shown that GAA_adjusted, xGAA_adjusted and sGAA correlates really well with team performance, so internally on a team the models work. If a player is undervalued by one of the models, then other players on the same team must be overvalued.
I don’t trust Evolving-Hockey’s GSAx to be a great goaltender stat. As an example, I think Henrik Lundqvist is overrated in terms of GSAx (especially in the early years), so consequently the skaters on those Rangers teams must be underrated.
The GAR and xGAR models from Evolving-Hockey are primarily used for player evaluations, but I think these redefined GAA models can be great for team evaluations as well. One application could be to make performance charts, where you look at the performance of a particular team over time.
Here’s an example of Anaheim. The x-axis is year (year 8 = 07/08, year 9 = 08/09 and so on) and the y-axis is goal differential. In this performance chart I’ve just compared the actual goal differential to the two models.
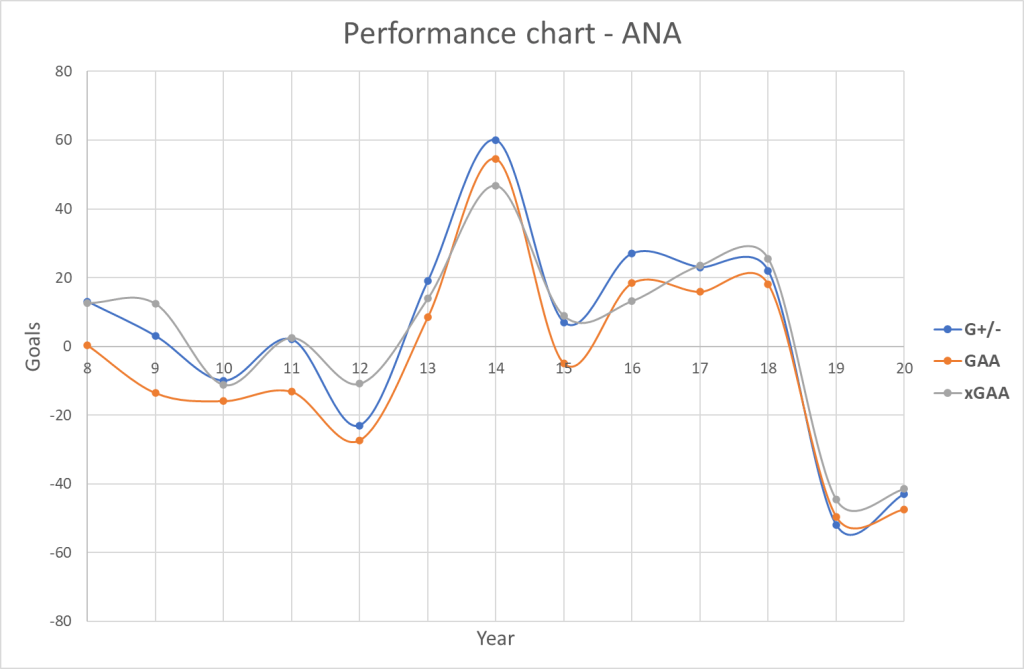
And here’s the combined model (sGAA) compared to the actual G+/-

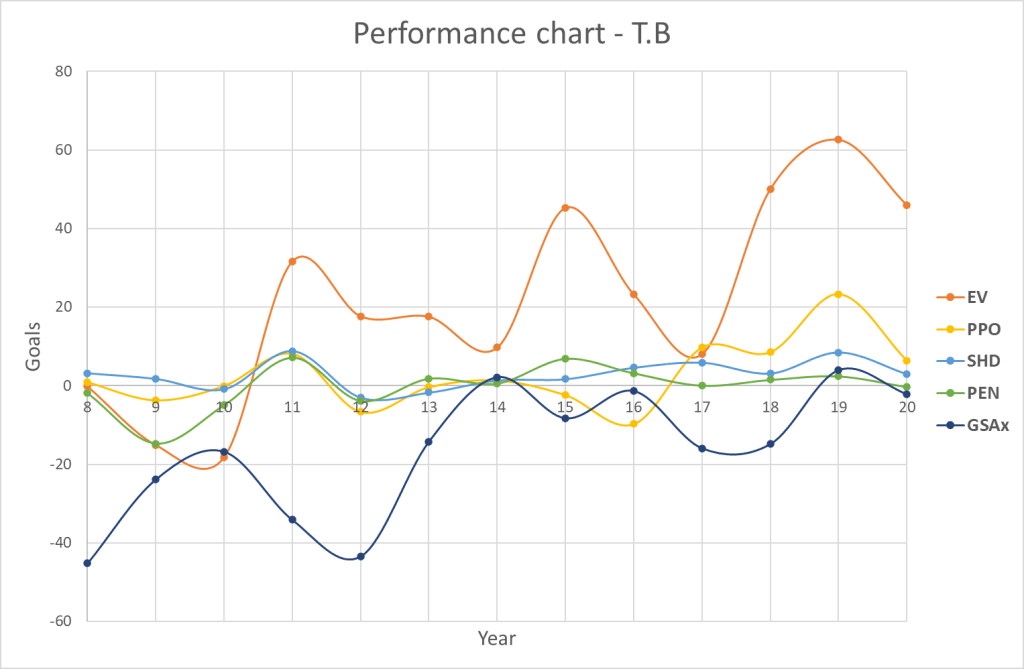
You could also look at the components individually. Here’s an example of Tampa Bay, where I’ve used sGAA components:
The possibilities are endless. You can compare the goaltending on different teams or you can compare EVO vs. EVD over time. The sGAA data can be downloaded here.
Perspective:
Going forward further evaluation of the sGAA model is needed. One way to do so, would be to look at repeatability. How repeatable is each component from year to year? This is a very important knowledge to have, when it comes to evaluating the predictive power of the model.
It’s also worth taking a deeper look at the goaltending stats. Can we improve on the GSAx data?
To end this article, I have added tables of the top 20 skaters in GAR, xGAR and sGAA along with the top 20 goalies in GAR. I will just leave the tables uncommented, but it gives you an opportunity to compare GAR/xGAR to the redefined models.
Top 20 skaters: GAR 2019/2020
| Player | GP | TOI_ALL | GAR | GAA adj | Rank GAR | Rank GAA adj |
|---|---|---|---|---|---|---|
| Artemi Panarin | 69 | 1422 | 24.8 | 17.6 | 1 | 2 |
| Elias Pettersson | 68 | 1260 | 23.9 | 16.9 | 2 | 3 |
| Ryan Ellis | 49 | 1151 | 23.1 | 18.7 | 3 | 1 |
| Brayden Point | 66 | 1248 | 21.5 | 15.2 | 4 | 4 |
| Brad Marchand | 70 | 1362 | 20.7 | 14.5 | 5 | 5 |
| Nathan MacKinnon | 69 | 1465 | 19.7 | 12.6 | 6 | 9 |
| Ryan Pulock | 68 | 1524 | 19.3 | 13.8 | 7 | 6 |
| Alex Pietrangelo | 70 | 1689 | 18.3 | 13.0 | 8 | 8 |
| Victor Hedman | 66 | 1587 | 18.1 | 13.0 | 9 | 7 |
| David Pastrnak | 70 | 1327 | 17.8 | 11.1 | 10 | 14 |
| Roman Josi | 69 | 1778 | 17.8 | 11.9 | 11 | 11 |
| Charlie McAvoy | 67 | 1552 | 16.8 | 11.3 | 12 | 13 |
| Max Pacioretty | 71 | 1271 | 16.8 | 9.9 | 13 | 20 |
| Jaccob Slavin | 68 | 1591 | 16.6 | 12.1 | 14 | 10 |
| Jack Eichel | 68 | 1502 | 16.5 | 9.9 | 15 | 21 |
| Auston Matthews | 70 | 1468 | 16 | 8.6 | 16 | 30 |
| Connor McDavid | 64 | 1399 | 15.9 | 10.5 | 17 | 16 |
| Cale Makar | 57 | 1198 | 15.8 | 11.7 | 18 | 12 |
| Bryan Rust | 55 | 1087 | 15.8 | 11.1 | 19 | 15 |
| Mark Stone | 65 | 1261 | 15.8 | 9.6 | 20 | 22 |
Top 20 skaters: xGAR 2019/2020
| Player | GP | TOI_ALL | xGAR | xGAA adj | Rank xGAR | Rank xGAA adj |
|---|---|---|---|---|---|---|
| Auston Matthews | 70 | 1468 | 20.9 | 18.0 | 1 | 1 |
| Brad Marchand | 70 | 1362 | 19.9 | 17.3 | 2 | 2 |
| David Pastrnak | 70 | 1327 | 17.4 | 15.1 | 3 | 3 |
| Elias Pettersson | 68 | 1260 | 17.2 | 13.7 | 4 | 5 |
| Jack Eichel | 68 | 1502 | 16.7 | 12.4 | 5 | 9 |
| Nikita Kucherov | 68 | 1283 | 16.6 | 13.5 | 6 | 6 |
| Nathan MacKinnon | 69 | 1465 | 16.1 | 11.9 | 7 | 16 |
| Artemi Panarin | 69 | 1422 | 15.7 | 12.1 | 8 | 13 |
| Jared Spurgeon | 62 | 1400 | 15 | 14.5 | 9 | 4 |
| Mika Zibanejad | 57 | 1233 | 14.7 | 12.2 | 10 | 10 |
| Travis Konecny | 66 | 1109 | 14.6 | 11.9 | 11 | 17 |
| Shea Theodore | 71 | 1579 | 14.3 | 12.0 | 12 | 15 |
| Dominik Kubalik | 68 | 978 | 14.2 | 12.1 | 13 | 11 |
| Oliver Bjorkstrand | 49 | 879 | 14 | 12.5 | 14 | 8 |
| Alex Pietrangelo | 70 | 1689 | 13.9 | 12.1 | 15 | 12 |
| Roman Josi | 69 | 1778 | 13.5 | 11.3 | 16 | 18 |
| Jake Guentzel | 39 | 805 | 13.4 | 12.1 | 17 | 14 |
| Leon Draisaitl | 71 | 1605 | 12.9 | 7.7 | 18 | 46 |
| Brayden Point | 66 | 1248 | 12.7 | 9.2 | 19 | 28 |
| Anze Kopitar | 70 | 1473 | 12.7 | 8.8 | 20 | 30 |
Top 20 skaters: sGAA 2019/2020
| Player | GP | TOI_ALL | GAR | xGAR | sGAA | Rank sGAA |
|---|---|---|---|---|---|---|
| Brad Marchand | 70 | 1362 | 20.7 | 19.9 | 15.9 | 1 |
| Elias Pettersson | 68 | 1260 | 23.9 | 17.2 | 15.3 | 2 |
| Artemi Panarin | 69 | 1422 | 24.8 | 15.7 | 14.9 | 3 |
| Ryan Ellis | 49 | 1151 | 23.1 | 9.1 | 13.3 | 4 |
| Auston Matthews | 70 | 1468 | 16 | 20.9 | 13.3 | 5 |
| David Pastrnak | 70 | 1327 | 17.8 | 17.4 | 13.1 | 6 |
| Alex Pietrangelo | 70 | 1689 | 18.3 | 13.9 | 12.6 | 7 |
| Nathan MacKinnon | 69 | 1465 | 19.7 | 16.1 | 12.3 | 8 |
| Brayden Point | 66 | 1248 | 21.5 | 12.7 | 12.2 | 9 |
| Jared Spurgeon | 62 | 1400 | 14 | 15 | 11.7 | 10 |
| Roman Josi | 69 | 1778 | 17.8 | 13.5 | 11.6 | 11 |
| Victor Hedman | 66 | 1587 | 18.1 | 11.3 | 11.4 | 12 |
| Jack Eichel | 68 | 1502 | 16.5 | 16.7 | 11.1 | 13 |
| Charlie McAvoy | 67 | 1552 | 16.8 | 11.8 | 10.8 | 14 |
| Dougie Hamilton | 47 | 1094 | 13.2 | 12.7 | 10.8 | 15 |
| Adam Fox | 70 | 1323 | 14.9 | 12.1 | 10.6 | 16 |
| Oliver Bjorkstrand | 49 | 879 | 13.9 | 14 | 10.6 | 17 |
| Nikita Kucherov | 68 | 1283 | 14.1 | 16.6 | 10.5 | 18 |
| Jaccob Slavin | 68 | 1591 | 16.6 | 9.8 | 10.0 | 19 |
| Cale Makar | 57 | 1198 | 15.8 | 10.1 | 9.9 | 20 |
Top 20 goalies: GAR 2019/2020
| Player | GP | GAR | GAA | GSAx | Rank GAR | Rank GAA | Rank GSAx |
|---|---|---|---|---|---|---|---|
| Connor Hellebuyck | 58 | 26.7 | 18.0 | 25.1 | 1 | 1 | 1 |
| Tuukka Rask | 41 | 19.7 | 14.5 | 11.1 | 2 | 2 | 3 |
| Semyon Varlamov | 45 | 16.3 | 9.1 | 5.9 | 3 | 5 | 23 |
| Darcy Kuemper | 29 | 15.6 | 11.3 | 11.3 | 4 | 3 | 2 |
| Ben Bishop | 44 | 15.1 | 8.3 | 8.6 | 5 | 6 | 9 |
| Anton Khudobin | 30 | 14.4 | 10.6 | 8.3 | 6 | 4 | 11 |
| Corey Crawford | 40 | 14.2 | 7.5 | 10.4 | 7 | 9 | 4 |
| Antti Raanta | 33 | 13.4 | 8.1 | 8.8 | 8 | 7 | 8 |
| Jonathan Bernier | 46 | 12.9 | 5.4 | 4.3 | 9 | 17 | 26 |
| Jordan Binnington | 50 | 12.9 | 4.7 | 7.9 | 10 | 20 | 13 |
| Mackenzie Blackwood | 47 | 12.6 | 3.8 | 4.5 | 11 | 24 | 25 |
| Philipp Grubauer | 36 | 12.6 | 7.2 | 2.3 | 12 | 10 | 31 |
| Juuse Saros | 40 | 12.3 | 6.0 | 5.3 | 13 | 13 | 24 |
| Carter Hart | 43 | 11.9 | 5.6 | 8.4 | 14 | 16 | 10 |
| Elvis Merzlikins | 32 | 11.8 | 6.8 | 2.7 | 15 | 11 | 30 |
| Jacob Markstrom | 43 | 11.8 | 3.6 | 7.4 | 16 | 25 | 15 |
| Mikko Koskinen | 38 | 11.4 | 4.6 | 9.6 | 17 | 21 | 5 |
| Pavel Francouz | 34 | 11 | 5.7 | 6.3 | 18 | 15 | 18 |
| Jake Allen | 24 | 10.8 | 8.0 | 9.0 | 19 | 8 | 7 |
| Robin Lehner | 36 | 10.6 | 4.1 | 7.4 | 20 | 22 | 14 |
All data from http://www.Evolving-Hockey.com

5 thoughts on “Interpretation and redefining of Evolving-Hockey’s GAR and xGAR models.”