Introduction
In this article I basically seek answers to these two questions:
- Can a goaltender impact shot misses?
- How does this affect current goaltender metrics?
But before we get to that point, we need to answer a wide variety of questions. In this piece I’m solely looking at 5v5 data, and the shot information is found via Evolving-Hockey’s PBP query.
I’ve defined miss% as the number of misses per unblocked shot attempt (fenwick). So, to answer question 1 we need to determine who is responsible for the miss%.
The randomness of shot misses
Before we can talk about responsibility, we need to determine if shot misses is a completely random occurrence. If shot misses are random, we should see the miss% regress towards league average with a big enough sample size.
I don’t want to spend too much time discussing whether shot misses are random, because clearly they are not. Others have already shown this, so I will simply use this graph as an indication. It shows the miss% of goaltenders in one year (x-axis) compared to the miss% the following year. The minimum requirement is 500 fenwicks against in both seasons.
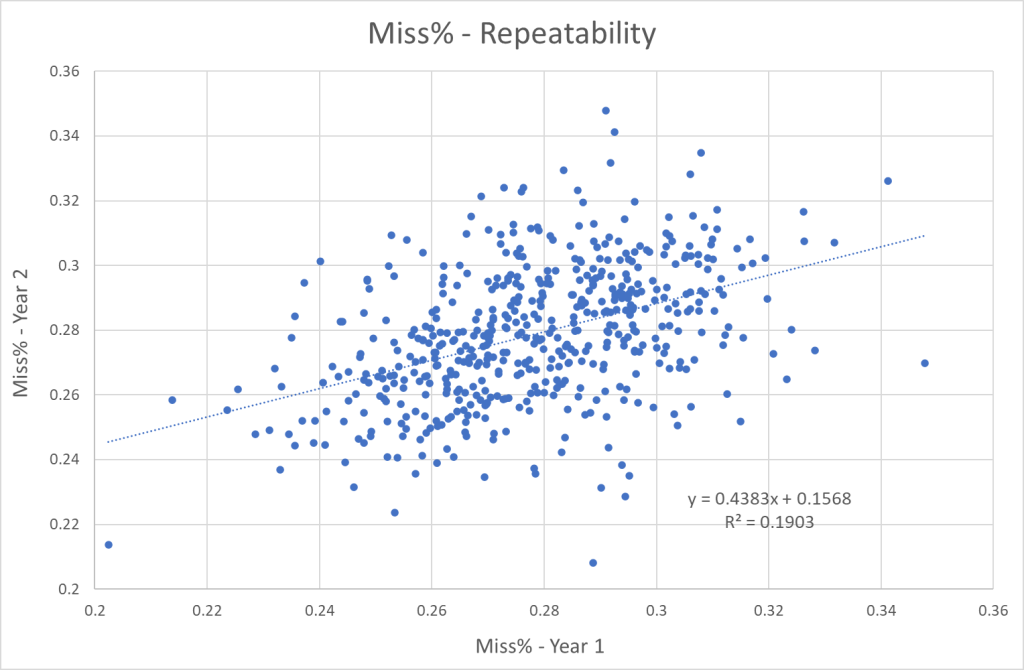
It clearly shows that miss% is somewhat repeatable from year to year. In other words, shot misses are not just some random occurrences, so next step is to find out who is responsible for these shot misses.
Who causes shot misses?
Other than simple variance shot misses can come from 3 different parties:
- The offense: Shooters being bad at hitting the net, shooters taking shots in bad situations or even shooters shooting wide on purpose.
- The defense: Forcing shots from bad situations, defending shooting lanes so it’s more difficult to hit the net or putting pressure on the shooter by being close.
- The goaltender: Leaving very little open net to shoot at, thus making it more likely that the shooter misses the net.
If we only look at shot misses from the perspective of the goaltender, we can probably ignore the offensive contribution, since the goaltender will see a lot of different offenses/shooters, so this should more or less even out over time. But before we look specifically at goaltenders, let’s look at the bigger picture.
Macro perspective – The league
Are there any leaguewide trends, when it comes to shot misses?
Here’s how miss% have evolved over time in the league. The graph shows the miss% of forwards, defenders and combined. The x-axis is the season – year 8 means season 07/08 and year 20 means season 19/20.
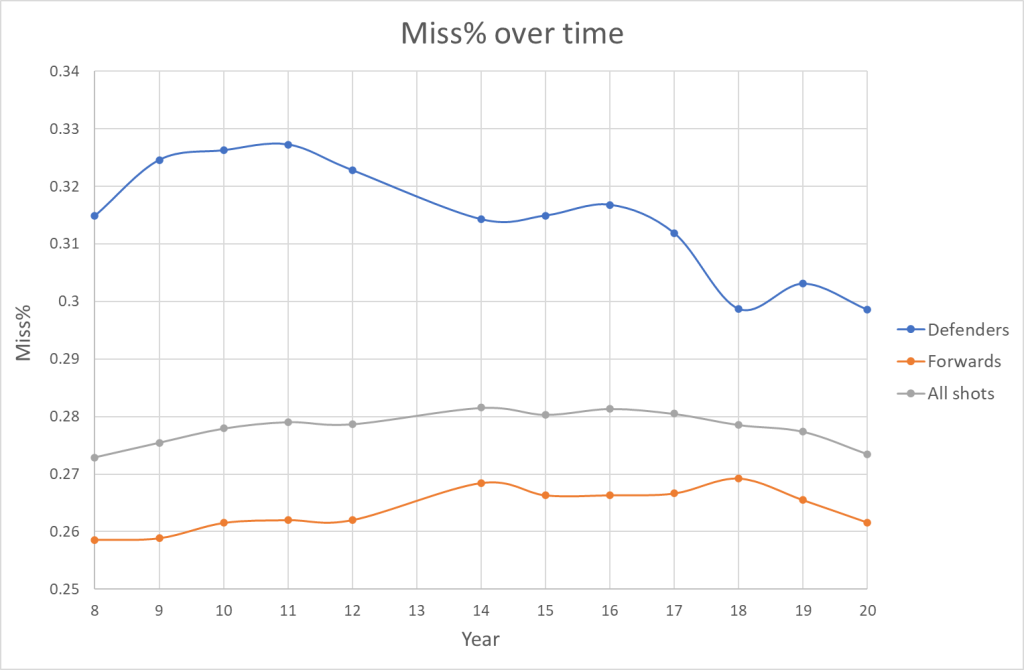
We see two interesting trends here. First of all, defenders generally miss the net more often forwards, and secondly defenders seem to be missing the net less and less.
Intuitively, it makes sense that defenders miss the net more often than forwards, since they generally shoot from a greater distance. This fact is interesting, because it likely means shooter composition plays a role in shot misses. How big a percentage of the shots are taken by defenders?
The next graph shows just that. How big a percentage of shots are taken by defenders leaguewide over time?
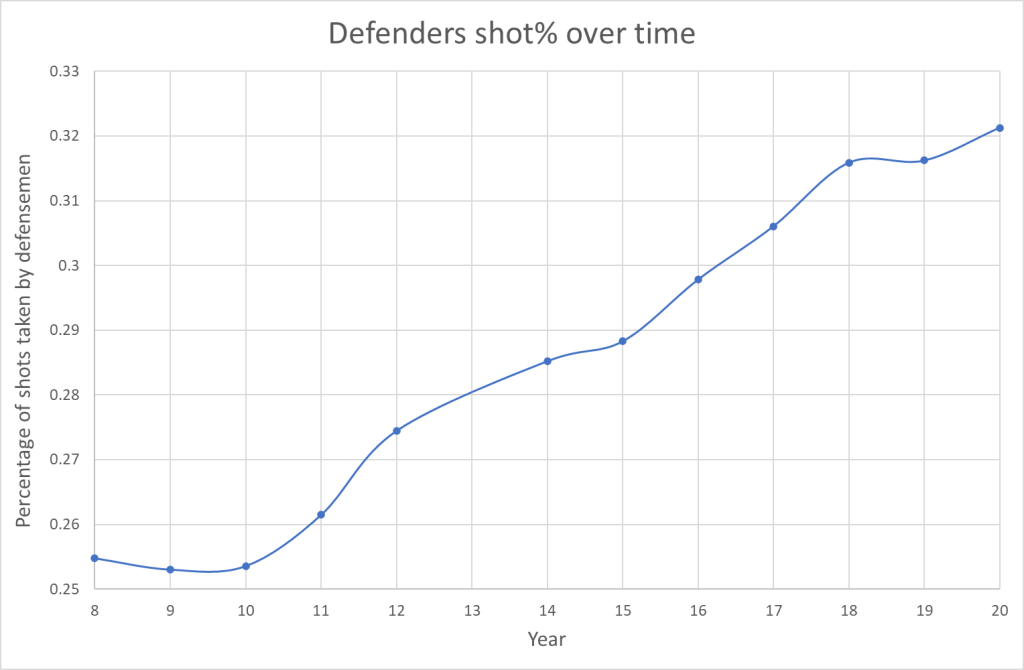
We see a clear increase in defender shots. 10-15 years ago, around 1/4 of all shots were taken by defenders. Today that number is closer to 1/3.
The final thing, I want to look into at the macro level is shot type. Let’s start by looking at miss% for the different shot types:
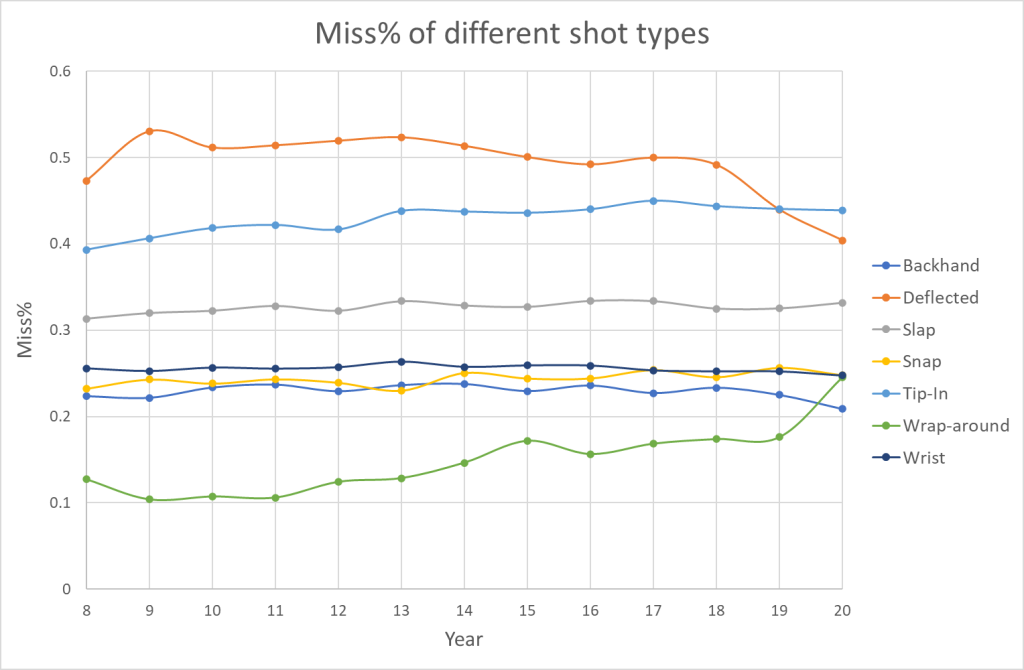
Here we see that the miss% is relatively stabile over time, and that slap shots tend to miss the net more often than snap shots and wrist shots.
This next graph shows the usage of each shot type. So, it’s the percentage of each shot type compared to the total number of unblocked shot attempts:
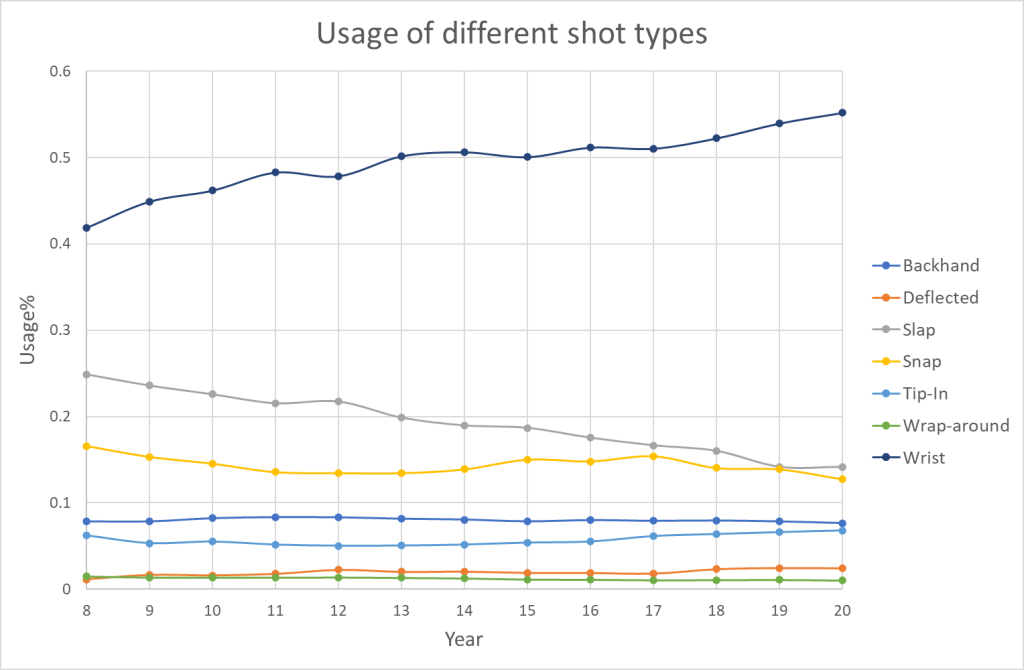
The interesting thing to take notice of here, is that slap shots are trending downwards, while wrist shots are trending upwards. This probably explains why defenders miss the net less often now. They shoot more wrist shots and less slap shots.
So, just to conclude the macro perspective. We have shown that shooter composition (forwards/defenders) and shot types are important factors, when we are discussing shot misses.
Meso perspective – The teams
The theory is that goaltenders can greatly impact shot misses, so I think it’s interesting to compare miss%(for) and miss%(against) at the team level. If goaltenders are the primary cause for shot misses, we should expect a greater variance in miss%(against) compared to miss%(for). Teams have the same few goaltenders for every game, but face a wide variety of different goaltenders. In other words, you would expect the goaltender effect to even out when looking solely on the miss%(for).
I have looked at every team from 07/08 to 19/20 (the 12/13 season excluded due to sample size), and compared miss%(for) and (against) to the league average. The average yearly difference between miss%(against) and the league average miss% is 1.35%. For the miss%(for) the average difference is 1.30%.
In other words, the variance on shot misses against are almost the same as the variance on shot misses for. This is not what we would expect, if goaltending is the primary cause for shot misses.
I have also compared the repeatability of miss%(for) and miss%(against). The following graph shows the correlation between miss%(for) in one year compared to miss%(for) the next year.
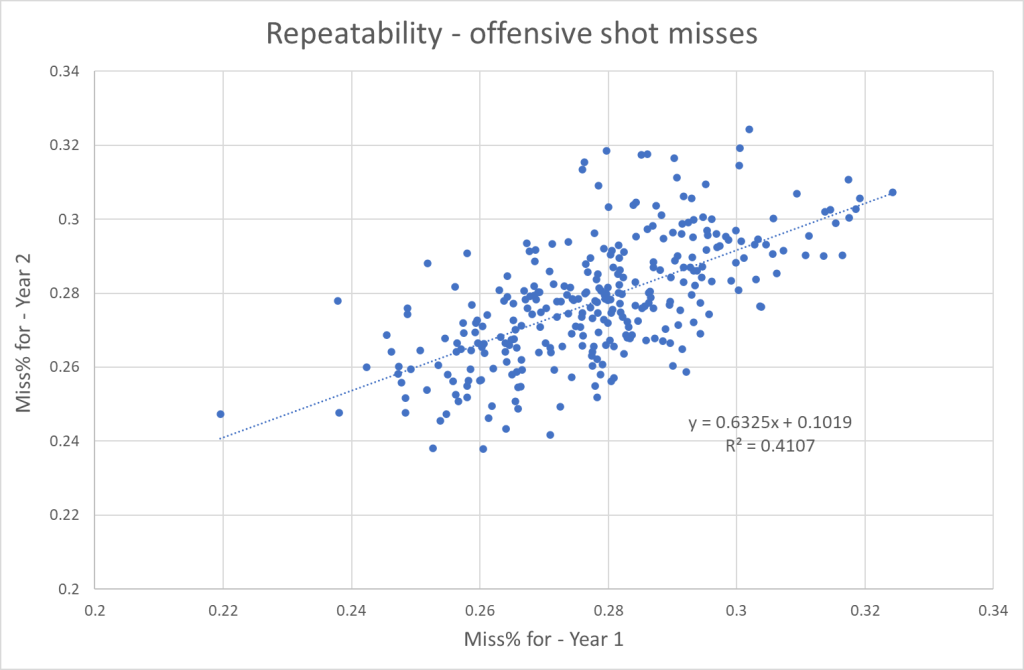
We see a very clear repeatability of miss%(for). This indicates that even though the goaltender effect should even out when looking at offensive shot misses, we still see a great repeatability.
I have obviously done the same thing for miss%(against).
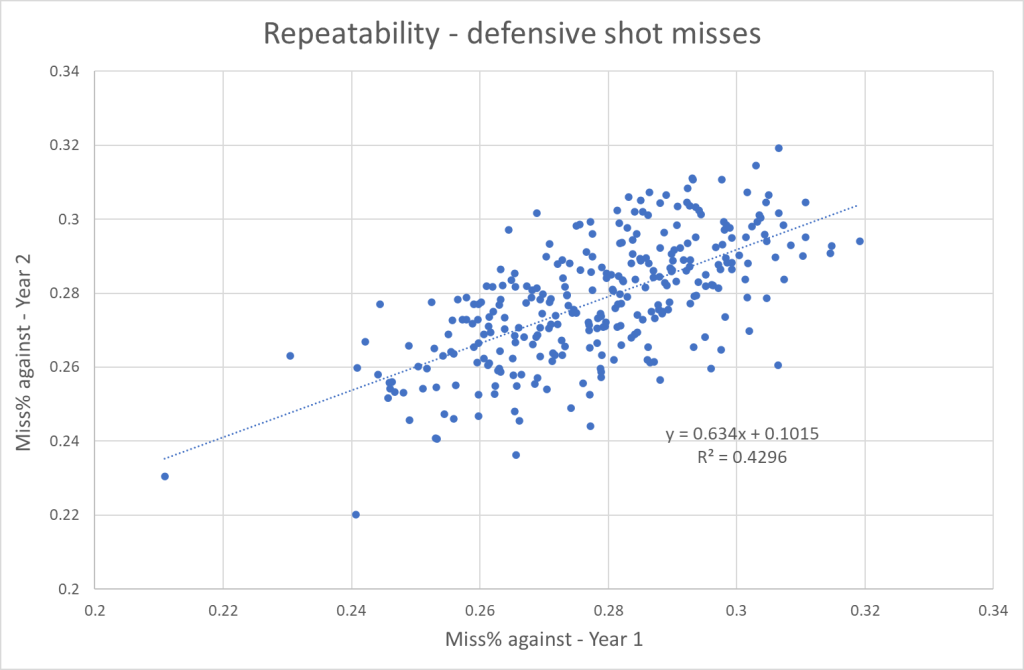
It shows a very similar correlation, indicating that miss%(against) is more or less as repeatable as miss%(for).
Conclusion of the meso perspective: There’s very little difference between the variance and repeatability of shot misses for and against. This is not what we would expect if goaltending was the primary cause of shot misses. This is not to say goaltending have no impact on shot misses.
Micro perspective – The goaltenders (skaters, coaches)
In the micro perspective I will focus on goaltenders, but it would also be interesting to look at how players and coaches can impact shot misses. That will have to wait for another article though.
Let’s start by looking at some names. I have looked at career numbers (minimum 2000 FA), and here are the 10 best goaltenders in terms of miss%. I have compared the shot misses to league average, so dMiss means misses above average and dMiss% means Miss% above average.
| Goalie | FA | Miss | dMiss | Miss% | dMiss% |
|---|---|---|---|---|---|
| VESA.TOSKALA | 4087 | 1246 | 122.7 | 0.305 | 0.030 |
| JEFF.DESLAURIERS | 2146 | 657 | 61.2 | 0.306 | 0.029 |
| MANNY.LEGACE | 3254 | 980 | 86.1 | 0.301 | 0.026 |
| ILYA.BRYZGALOV | 12395 | 3761 | 317.0 | 0.303 | 0.026 |
| JONAS.HILLER | 12150 | 3668 | 277.4 | 0.302 | 0.023 |
| JONATHAN.QUICK | 18864 | 5676 | 416.5 | 0.301 | 0.022 |
| MATHIEU.GARON | 5516 | 1649 | 119.9 | 0.299 | 0.022 |
| ANTTI.RAANTA | 5683 | 1706 | 123.3 | 0.300 | 0.022 |
| PETER.BUDAJ | 7721 | 2309 | 161.6 | 0.299 | 0.021 |
| JUSTIN.PETERS | 2582 | 774 | 49.4 | 0.300 | 0.019 |
The best goalies in the league faces about 30% misses. For comparison here’s the 10 worst goaltenders in terms of shot misses:
| Goalie | FA | Miss | dMiss | Miss% | dMiss% |
|---|---|---|---|---|---|
| COREY.CRAWFORD | 14526 | 3592 | -466.0 | 0.247 | -0.032 |
| TIM.THOMAS | 9300 | 2290 | -291.5 | 0.246 | -0.031 |
| MARTIN.BRODEUR | 9594 | 2399 | -265.7 | 0.250 | -0.028 |
| LINUS.ULLMARK | 3205 | 813 | -74.6 | 0.254 | -0.023 |
| STEVE.MASON | 13903 | 3565 | -321.8 | 0.256 | -0.023 |
| NIKOLAI.KHABIBULIN | 6042 | 1548 | -127.6 | 0.256 | -0.021 |
| ROBIN.LEHNER | 9813 | 2531 | -207.1 | 0.258 | -0.021 |
| JIMMY.HOWARD | 15865 | 4099 | -329.3 | 0.258 | -0.021 |
| JOHAN.HEDBERG | 5069 | 1308 | -97.5 | 0.258 | -0.019 |
| ANDREI.VASILEVSKIY | 8215 | 2137 | -146.6 | 0.260 | -0.018 |
These goalies face about 25% shot misses, so there is a real difference here. That being said it’s very difficult to see any connection between these goalies. I certainly wouldn’t say that the first group is much better than the second group.
Goaltender traits
The common narrative is that the quality of the goaltender can affect the number of shot misses. A good goaltender will make a shooter miss the net more often than a bad goaltender will. So, let’s test this theory.
I have looked at seasonal data (from 07/08 to 19/20) and included all goalies with more than 500 fenwicks against. This gives us 718 datapoints.
Here’s how miss% correlates with Sv%:
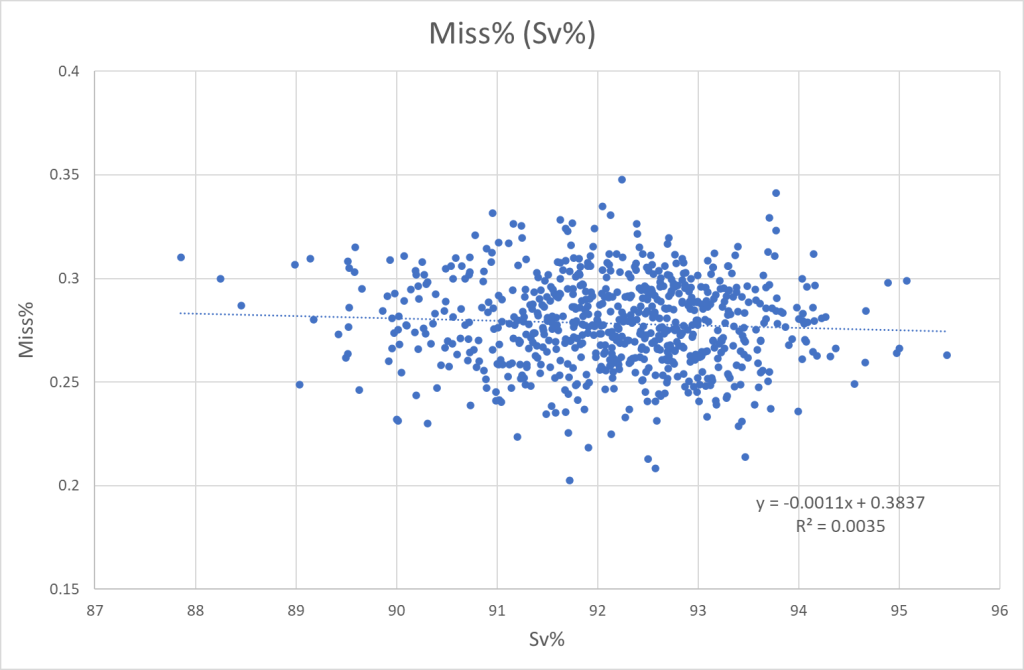
We don’t see any correlation between miss% and Sv%. If anything, there’s a slight inverse correlation. However, you could make an argument that Sv% isn’t a great way to measure goaltender quality, because it doesn’t include shot quality.
So, I have calculated GSAx of each goaltender, but I have only used shots on goal. In other words, it’s GSAx based on shots instead of fenwicks. I have adjusted for score/venue and rink bias. Now we can compare miss% to GSAx/shot (also called dSv%):
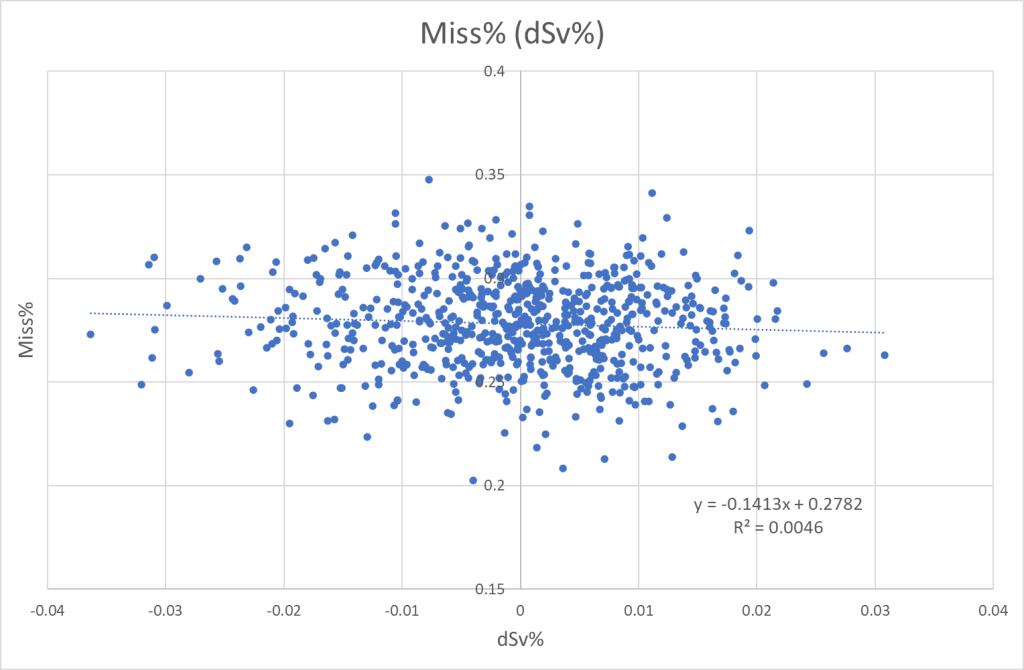
Again, we see a slight inverse correlation, but we can definitely conclude that the better goaltenders don’t face more shot misses. The inverse correlation could have something to do with saved misses. If a goaltender saves a lot of shots, that would have otherwise been misses, then the miss% decreases and the Sv%/dSv% increases.
If quality doesn’t correlate with shot misses, another possible explanation could be the size of the goaltender. Here’s the miss% as a function of height and weight:
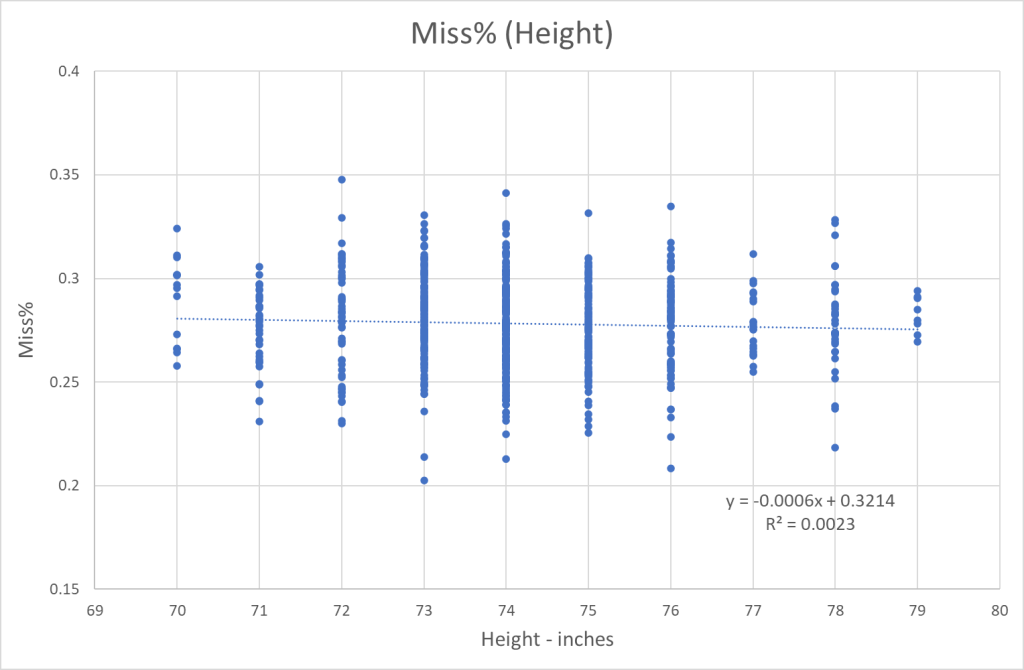
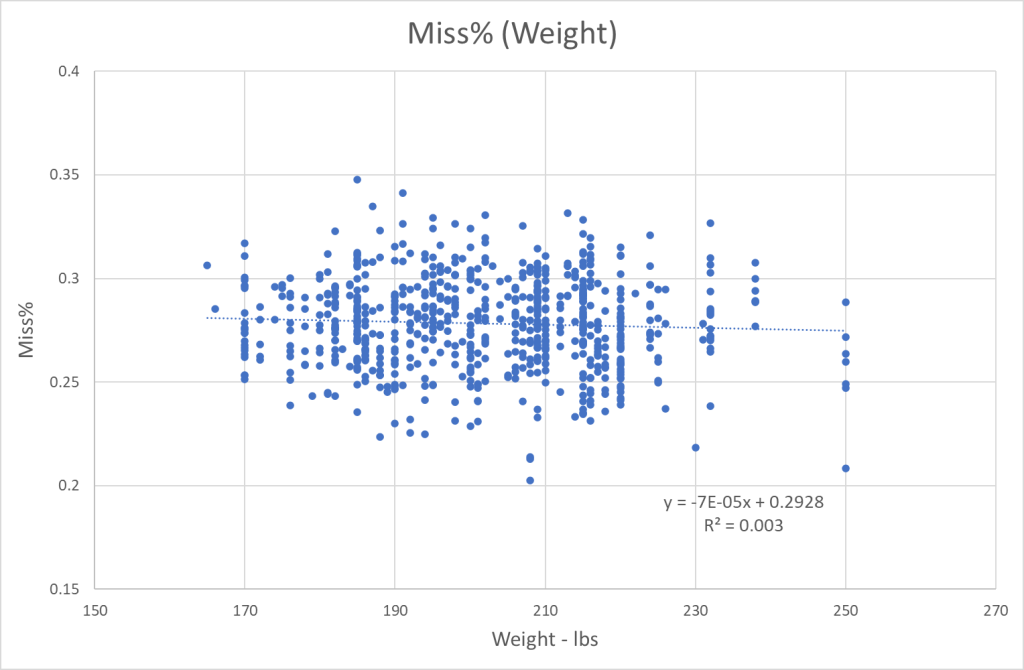
We don’t see any correlation between goaltender size and miss%.
It would be interesting to see if there’s any connection between shot misses and how deep in net the goalie plays. But we don’t have that data, so that hypothesis can’t be tested. Instead, we will take a look at non-goalie traits that may be connected to shot misses.
Non-goaltender traits
The following traits are things that I don’t believe the goaltender has any affect on. The first thing that comes to mind is shot distance. Intuitively, it makes sense that misses are correlated with shot distance. Here’s the shot distance as a function of miss%:
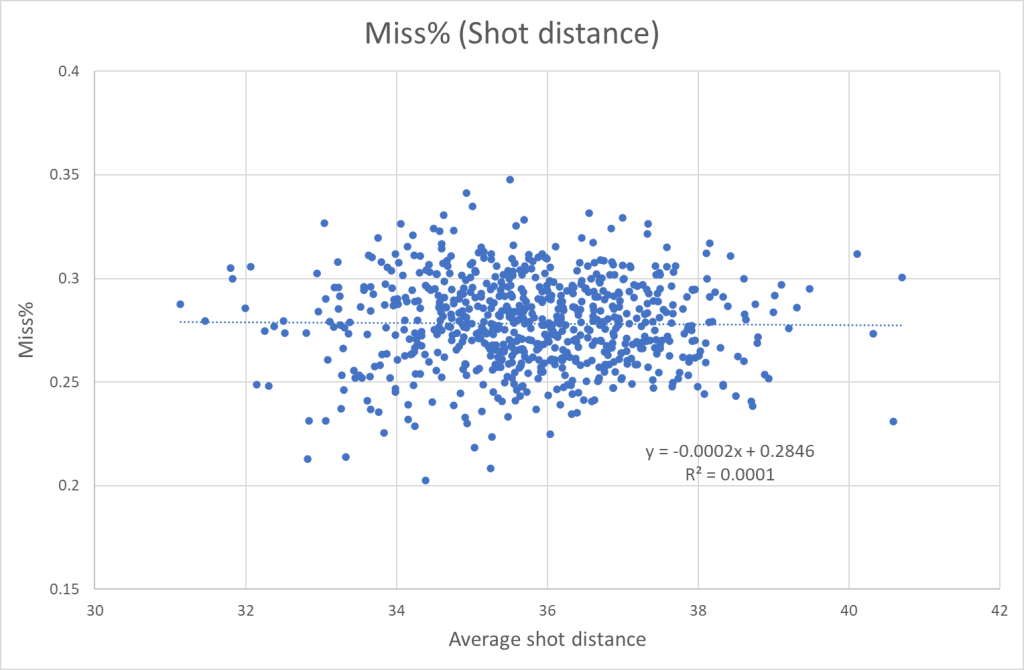
The shot distance isn’t adjusted for rink bias, but I also tried looking at away shot distance only, and there was no apparent difference. So, to my surprise there doesn’t appear to be any connection between shot distance and shot misses.
I also tried to look at block% (blocks per corsi). The theory is that teams with a high block% defend shooting lanes, thus making it harder to hit the net. Here’s the correlation between miss% and block%:
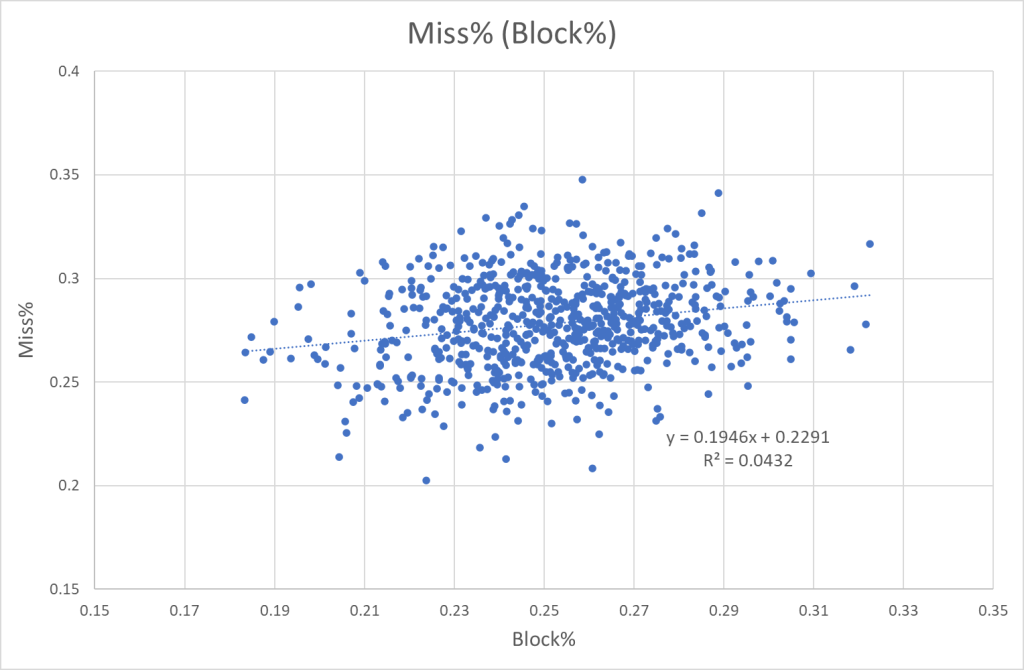
Here we do see some correlation. So, goaltenders who has a lot shots blocked in front of them also see an increase in shot misses. It’s difficult to quantify how big this effect is, but at least we see a correlation.
We could also look at shooter composition. We saw earlier that defenders miss the net more often forwards, so it makes sense that goaltenders who face a lot of defender shots will have a higher miss%. I have looked at this for the last 3 seasons:
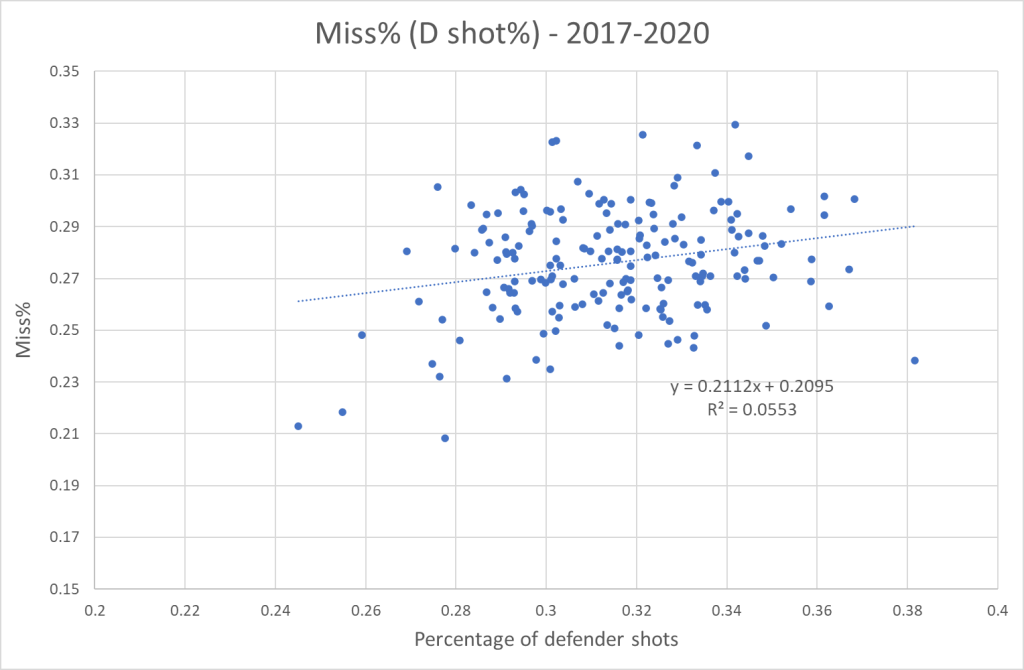
There does appear to be some correlation between shot misses and the number of shots taken by defensemen.
The last thing I looked at was shot type. Previously, we saw that slap shots missed the net more often than wrist shots and snap shots, so maybe there’s a connection between slap shot% and miss%:
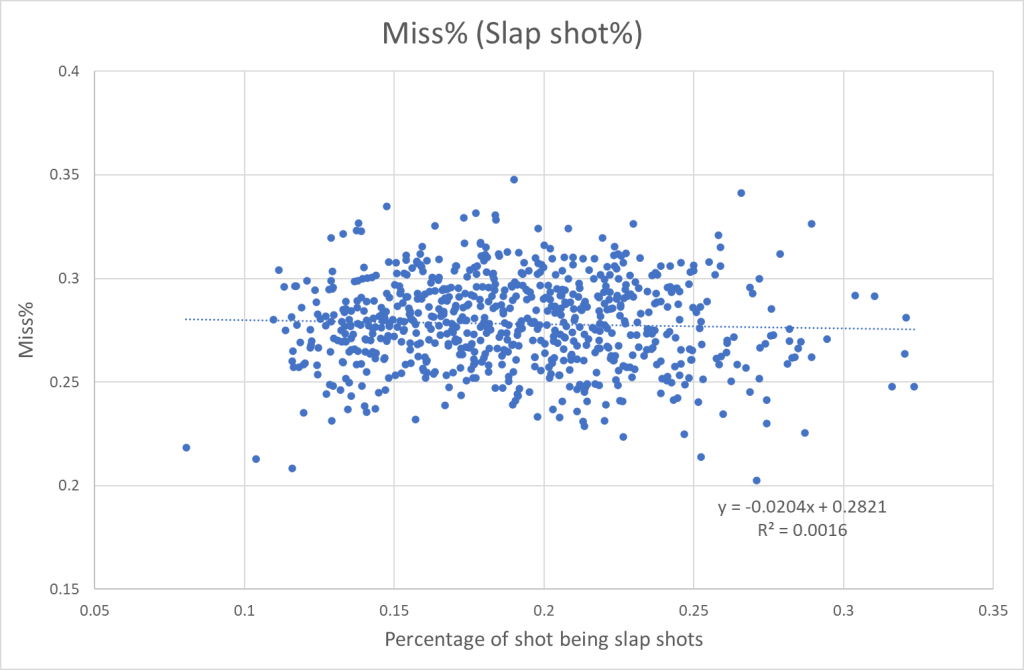
This effect is not big enough to be seen in the graph.
What can we conclude from all of this? Well, shot blocking and shooter composition do seem to have an impact on shot misses. Everything else might have a very small impact on shot misses, but it’s too small to be seen in the graphs.
What if GSAx was based on shots instead of fenwicks?
I think I have shown above that goaltenders have very little impact on shot misses, and that the quality of the goaltender certainly doesn’t matter. That leads us to the second question in the introduction. How does this affect current goaltender metrics? More specifically, what would happen if we based GSAx solely on shots against instead of fenwicks against?
Today, all credit of shot misses is given to the goaltender. The other extreme is to give no credit to the goalie for shot misses. I think the latter is closer to the truth, so I will make a GSAx model that completely ignores shot misses. In fact, I already did this earlier.
How will this change affect goaltenders? Here’s the 10 goalies who would gain the most from such a change. This is single season data:
| Goalie | Season | FA | GSAx(SA) | GSAx(FA) | Difference |
|---|---|---|---|---|---|
| TIM.THOMAS | 20112012 | 1703 | -1.48 | -8.51 | 7.03 |
| NIKOLAI.KHABIBULIN | 20072008 | 1166 | -3.74 | -10.72 | 6.98 |
| ANTTI.NIEMI | 20102011 | 1809 | 1.73 | -3.94 | 5.67 |
| ANDREI.VASILEVSKIY | 20172018 | 2161 | 9.47 | 3.96 | 5.51 |
| SERGEI.BOBROVSKY | 20132014 | 1693 | 8.69 | 3.38 | 5.31 |
| COREY.CRAWFORD | 20162017 | 1771 | 10.82 | 5.63 | 5.19 |
| TIM.THOMAS | 20092010 | 1222 | -11.03 | -16.11 | 5.09 |
| ROBIN.LEHNER | 20192020 | 1225 | 3.46 | -1.36 | 4.82 |
| CORY.SCHNEIDER | 20142015 | 2030 | 15.31 | 10.52 | 4.80 |
| PEKKA.RINNE | 20172018 | 1835 | 16.03 | 11.28 | 4.74 |
And of course, here’s the goalies who would lose the most:
| Goalie | Season | FA | GSAx(SA) | GSAx(FA) | Difference |
|---|---|---|---|---|---|
| MIKE.SMITH | 20162017 | 2118 | 13.07 | 20.11 | -7.04 |
| CAM.WARD | 20152016 | 1558 | -9.26 | -2.43 | -6.82 |
| JONATHAN.BERNIER | 20142015 | 1879 | -0.59 | 5.88 | -6.48 |
| KARI.LEHTONEN | 20162017 | 1782 | 9.84 | 16.20 | -6.36 |
| BRADEN.HOLTBY | 20162017 | 1938 | 20.06 | 26.40 | -6.34 |
| ANTTI.RAANTA | 20172018 | 1612 | 13.38 | 19.66 | -6.28 |
| JONATHAN.QUICK | 20112012 | 2013 | 12.55 | 18.47 | -5.92 |
| MARC-ANDRE.FLEURY | 20092010 | 1849 | -8.67 | -2.77 | -5.90 |
| JEFF.DESLAURIERS | 20092010 | 1692 | -13.50 | -7.66 | -5.84 |
| JONATHAN.QUICK | 20172018 | 2067 | 11.50 | 17.33 | -5.84 |
In other words, a change like this could mean as much as +/- 7 goals in single season GSAx. And remember, this is just 5v5 data, the total effect could be even larger.
So, let’s look at career numbers. Here’s the 10 goalies gaining the most:
| Goalie | FA | GSAx(SA) | GSAx(FA | Difference |
|---|---|---|---|---|
| COREY.CRAWFORD | 14526 | 77.81 | 49.71 | 28.10 |
| TIM.THOMAS | 9300 | 59.83 | 33.99 | 25.84 |
| PEKKA.RINNE | 19891 | 50.80 | 27.21 | 23.59 |
| JIMMY.HOWARD | 15865 | 21.46 | -0.86 | 22.32 |
| MARTIN.BRODEUR | 9594 | -16.56 | -37.94 | 21.37 |
| CORY.SCHNEIDER | 11844 | 36.31 | 18.71 | 17.59 |
| STEVE.MASON | 13903 | -19.41 | -34.28 | 14.87 |
| ROBIN.LEHNER | 9813 | -3.16 | -17.86 | 14.70 |
| ANDREI.VASILEVSKIY | 8215 | 30.03 | 16.51 | 13.52 |
| CRAIG.ANDERSON | 19144 | 9.71 | -3.61 | 13.32 |
And here’s the 10 goalies losing the most:
| Goalie | FA | GSAx(SA) | GSAx(FA) | Difference |
|---|---|---|---|---|
| CAM.WARD | 19153 | -4.13 | 29.27 | -33.40 |
| JONATHAN.QUICK | 18864 | 4.99 | 34.81 | -29.82 |
| ILYA.BRYZGALOV | 12395 | 14.42 | 32.60 | -18.17 |
| JONATHAN.BERNIER | 11548 | -10.10 | 7.92 | -18.02 |
| BRADEN.HOLTBY | 14563 | 47.06 | 61.01 | -13.95 |
| JONAS.HILLER | 12150 | 47.03 | 59.24 | -12.21 |
| VESA.TOSKALA | 4087 | -16.79 | -5.47 | -11.31 |
| PETER.BUDAJ | 7721 | -35.04 | -24.09 | -10.95 |
| KARI.LEHTONEN | 16392 | 14.31 | 25.19 | -10.88 |
| MIKE.SMITH | 18391 | 22.24 | 32.97 | -10.74 |
This clearly shows that moving from a fenwick based GSAx model to a shot based GSAx model is not some insignificant change. Shot misses are super important!
Conclusion
I think everyone (including myself) just bought the narrative that goaltenders can impact shot misses, and everything else regarding shot misses are just random. This assumption sounds intuitively right, and you wouldn’t think shot misses were particularly important. But it turns out shot misses are surprisingly repeatable, which actually makes them very important in any analysis.
I have shown above that there’s some correlation between shot misses and shooter composition as well as shot blocking. I haven’t found any clear evidence that goaltenders can impact shot misses though.
I personally think shot misses are mostly due to offensive and defensive strategies, but a lot more research needs to be done on this field.
Perspectives
This opens up an interesting discussion about expected goals models. Current models treat shot misses as completely random occurrences, so a shot is worth exactly the same whether it hits the net or not. The other extreme would be to base the xG model solely on shots that hit the net. I think this would be better, but a compromise is probably the preferred way to go. So, giving a shot has less value if it doesn’t hit the net. This way you give some credit to teams that consistently put up a good shot miss differential.
That leads me to the next perspective – creating a new simple on-ice metric:
MF% (misses for percentage) = miss%(for) – miss%(against) = (FF-SF)/(FF) – (FA-SA)/(FA)
This can help explain why some teams can outperform their xGF%. Obviously, goaltending and shooting talent plays a big role in this, but shot misses add another explanation. As an example, the New York Islanders consistently put up a low MF%, indicating that they have a good shot miss differential.
Going forward I will experiment a bit with making an xG-model where shots are weighed more than shot misses. That will probably be an off-season project though.
I will just end this piece with a couple of interesting questions:
- Can rink bias impact shot misses?
- Are there any connection between coaches and shot misses?
- Which players have good MF%? Shot blocking defensive defensemen?
Data from www.evolving-hockey.com and www.naturalstattrick.com

3 thoughts on “Goaltenders have no apparent influence on shot misses!”