
Introduction
The idea with this post is to explain all my statistical work up until this point. Most of it has already been explained in previous articles, but I want to collect it all in one place. And also add some insight on the thought process behind the models.
I’m hoping to write this as short and precise as possible, but this will eventually become a fairly long read – Sorry. I will add elements to this post whenever time allows it.
The process
Before we get into the specifics, I would like to discuss my usual approach to hockey statistics. Generally, the mathematics used in my modelling is fairly simple, so I think most of You can follow the process.
A lot of sports analysis is subjective – is player A better than player B? It depends on your preferences. You can judge a player by points, +/-, WAR, the eye test or something else. Either way, it’s difficult to quantify a player’s ability. There’s no agreed upon definition for player performance.
So instead, I’m on the lookout for clearly defined facts. Something I can use as a template for my modelling. This is why most of my modelling is done at the team level. Everyone, agrees that good teams win hockey games. Good teams can obviously lose in the short term, but if they keep losing, then they are not really good. It’s as simple as that. So, team performance is measured in wins, and wins come when you outscore your opponent. I’ve therefore defined team performance as team goal differential. I think everyone can agree with that definition.
Once you have a fact/result you can model after, you can refine the variables to best fit the template. In other words, I simply define a template and then make the model fit. When you choose this approach, there’s a clear risk of overfitting, which is why it’s important to use a very large sample size.
I will typically look to optimize the linear correlation in my refinement – increasing the R-squared value of a trendline. However, you could also refine the data towards the lowest log loss or something similar. Either way, this is the basic principle in most of my modelling.
Descriptive or predictive
A model can be descriptive and/or predictive in its nature. I’m using two distinct metrics in my modelling – One for describing past results and one for predicting future results. As an example, there’s a big difference between describing and predicting goaltending. Obviously, goaltending is important, so it’s a big part of describing results. However, predicting goaltending is near impossible because of the variance. This is why my predictive models put much less weight on goaltending. Not because it’s less important, but because it’s difficult to predict. In other words, it’s preferable to expect regression towards the mean.
Zero-sum modelling
The final concept I would like to mention before we can get started, is what I call zero-sum modelling. It basically means that I’m always using average as my baseline. I want all my metrics and variables to always add up to zero. So, if a defender is above zero in even strength defense, it simply means he has put up better than average defense compared to other defenders that season. This is different from most models, since most models use replacement level as the baseline.
I think zero-sum modelling makes the data easier to understand and interpret. It’s more intuitive. In a WAR model it’s difficult to compare forwards and defenders, because the difference between replacement level and average is larger for forwards than it is for defenders. This means forwards seem more impactful than they really are.
There are other advantages to using average as the baseline. It functions as an error detection tool. If a metric doesn’t add up to zero, there’s a mistake somewhere. Also, in a zero-sum model there’s a natural regression towards mean if the data is limited. I will get back to this later.
All in all, I think the good in zero-sum modelling outweigh the bad.
sGAA – Descriptive metric
With the above in mind, let’s look at the actual modelling. We will start with the descriptive metric, sGAA (goals above average and s because my last name is Skytte).
I’m using the great work of Evolving-Hockey as the basis for this model. So, the base will be their GAR, xGAR and GSAx (score and venue adjusted) models.
I want a model that can describe actual results, so I will compare the models to the actual team performance (team goal differential). In other words, I’m using team G+/- as the template for my modelling.
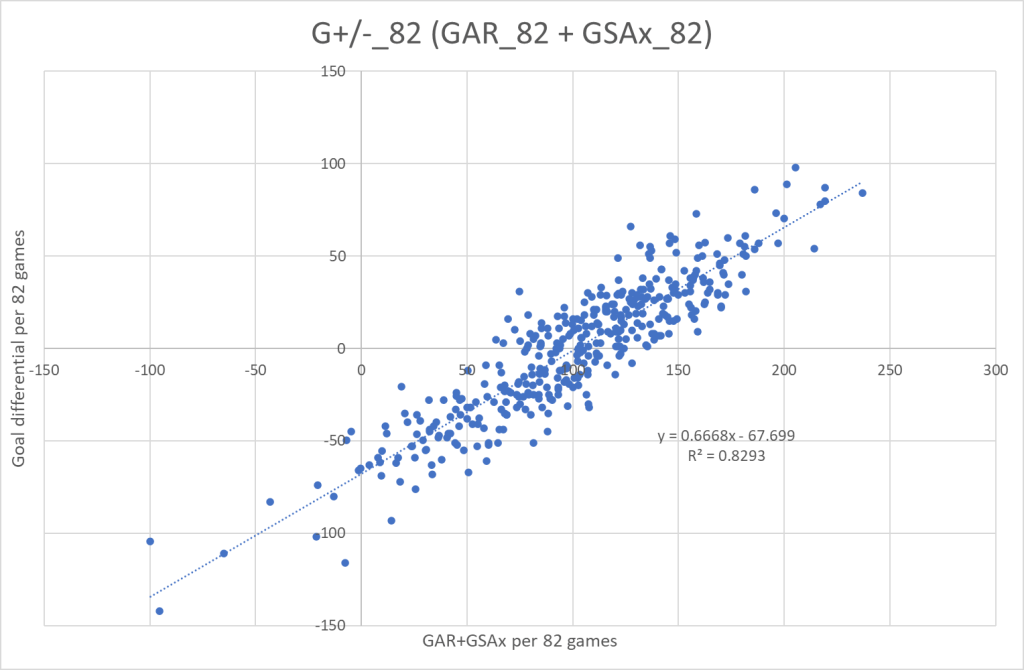
Let’s start by looking at the raw models. Here’s GAR(Skaters) + GSAx(Goaltenders) as a function of team G+/-. I’m using a large sample size – all seasons from 2007/2008 to 2019/2020. And the data is prorated to 82 games.
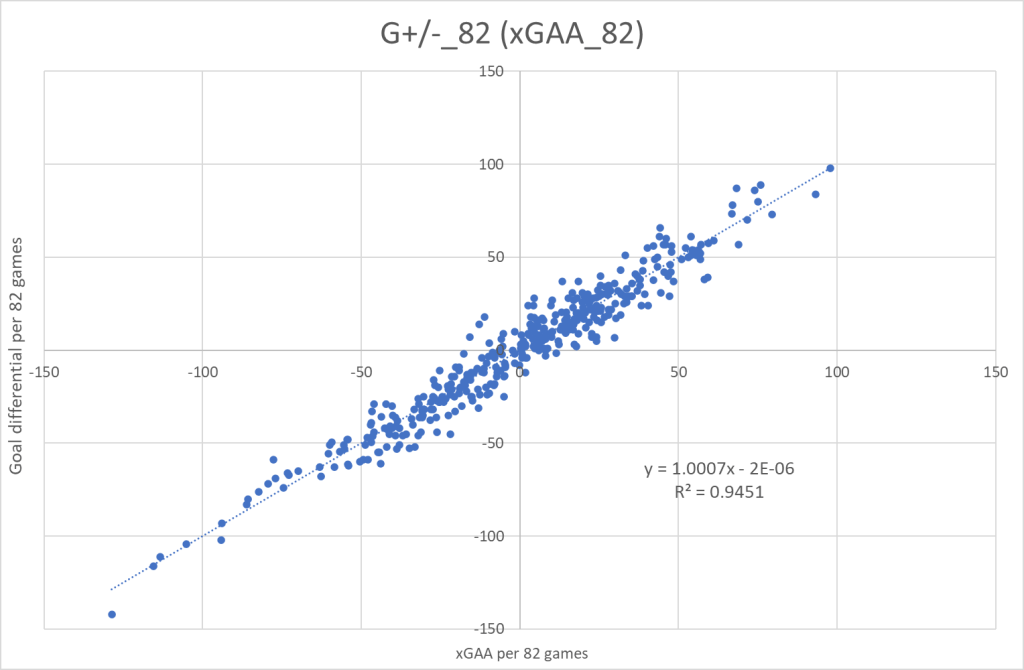
And we will do the same for xGAR + GSAx.

Next step is to “zero-sum” the data – converting it from GAR to GAA. The calculations for that process can be found here. Now I can refine each component to optimize the correlation with the template.
Here’s the refined GAA+GSAx graph:

And here’s the refined xGAA+GSAx graph:
Finally, my sGAA metric is simply a combination of the two refined models. That gives me a model consisting of 7 components similar to those in the GAR/xGAR models:
sGAA = sEVO + sEVD + sPPO + sSHD + sTake + sDraw + sGK(GSAx)
And here’s the specific calculations/refinement for each component:
sGAA = (1.00*GAA_EVO+1.14*xGAA_EVO)/2 + (0.71*GAA_EVD+1.39*xGAA_EVD)/2 + (0.91*GAA_PPO+1.37*xGAA_PPO)/2 + (0.91*GAA_SHD+1.52*xGAA_SHD)/2 + 0.92*GAA_Take + 1.02*GAA_Draw + 0.93*GSAx
This is what the final graph looks like:

Now, I have a model that can describe team results really well. This doesn’t necessarily mean it describes player performances perfectly. However, if one player on a team is overvalued by the sGAA model, then at least one other player has to be undervalued.
You can find team sGAA and some team charts in this workbook. The individual player data won’t be publicly available, since it may be too close to the original GAR and xGAR models. There might be a copyright infringement. Better safe than sorry.
Make sure to go support the EvolvingWild twins if you can – they do amazing work.
Stats from www.evolving-hockey.com

One thought on “Hockey-Statistics”