
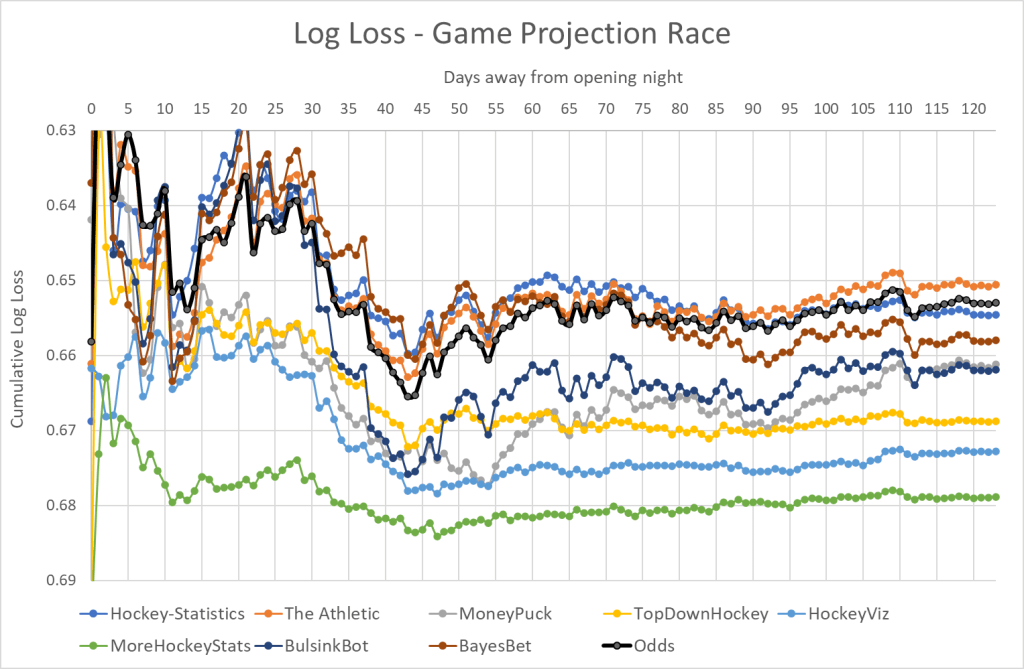
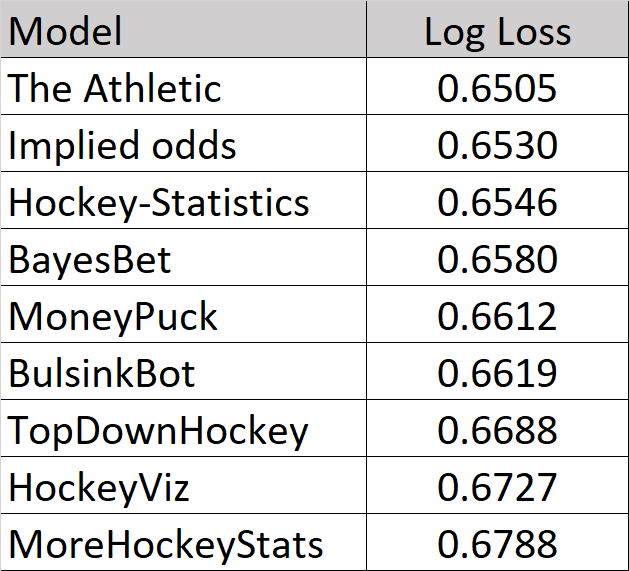
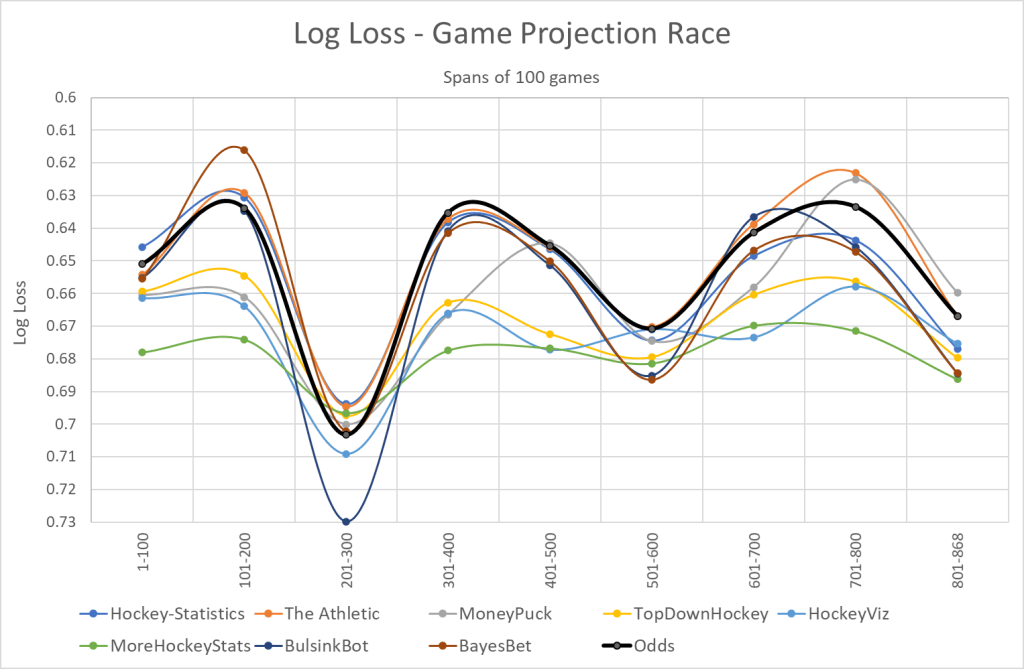
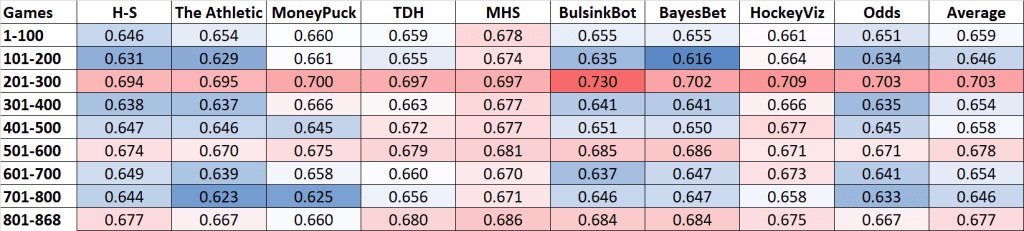
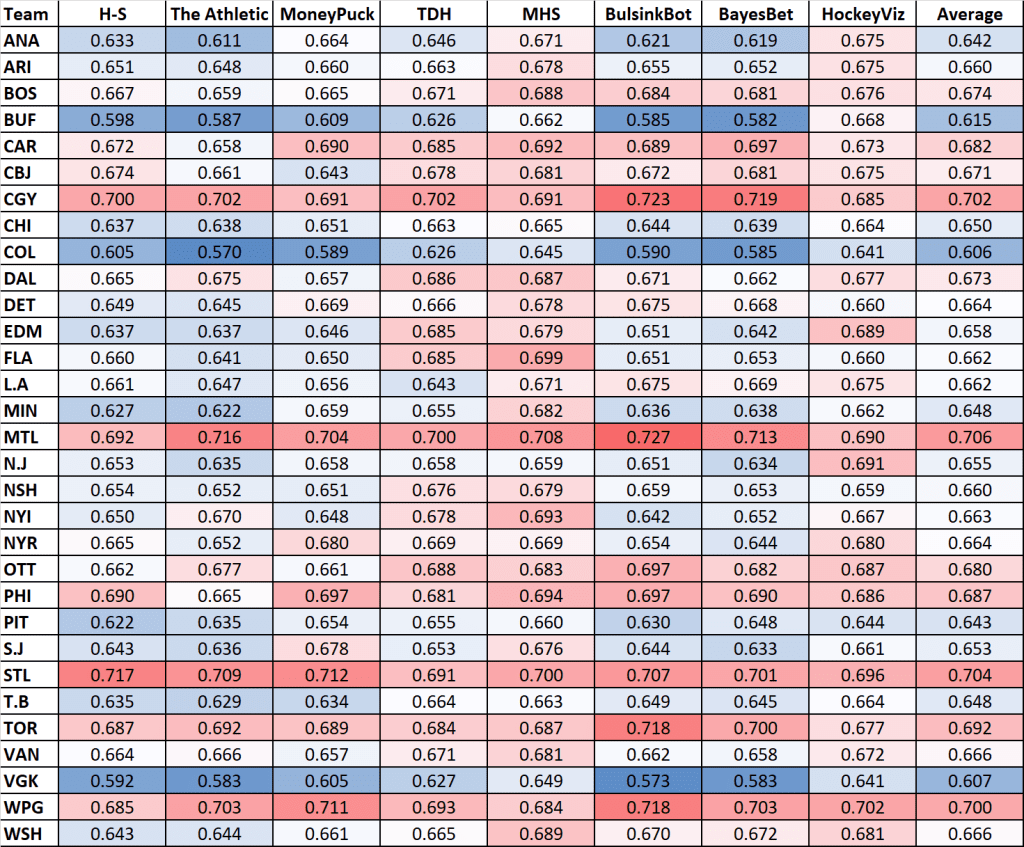
Here’s how the model compares to other public models:
Here’s the log loss for each team:
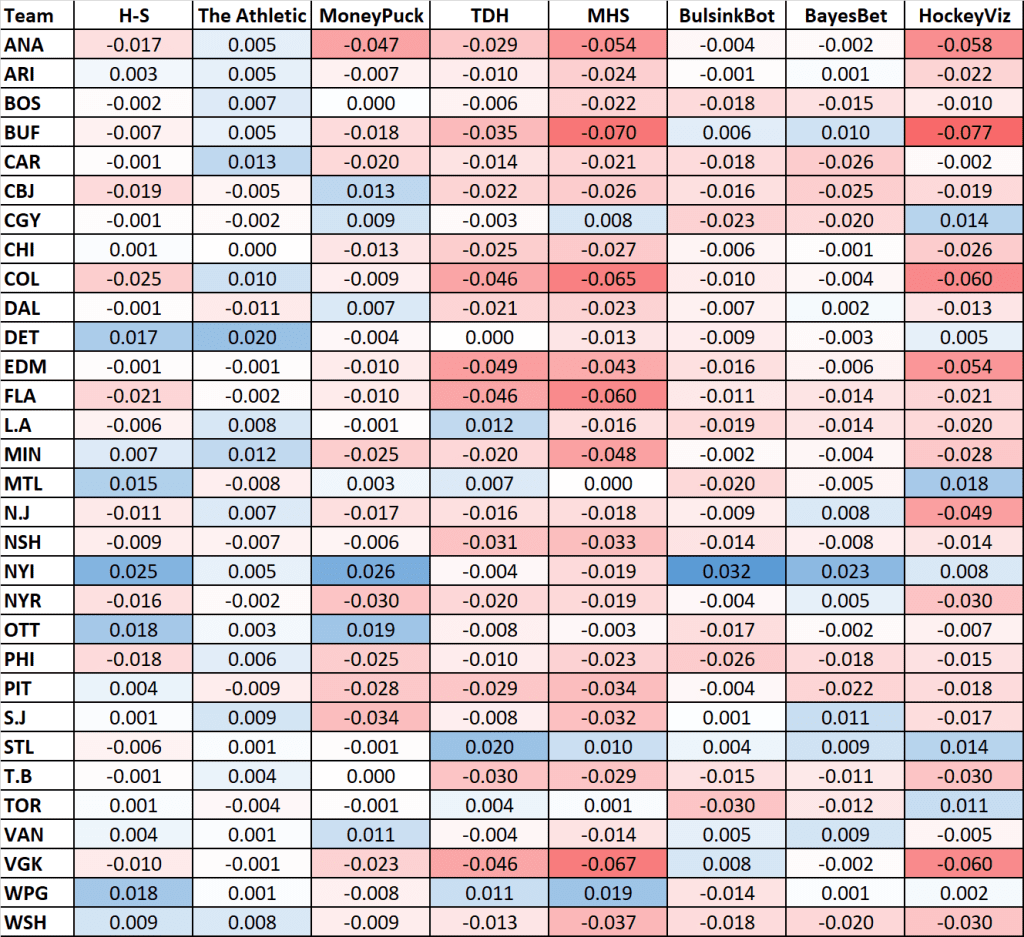
And here’s the log loss of each team compared to the imlplied odds:
Game projections can be found daily on Twitter. All games will be updated here from time to time (Updated June 6th 2021).
Betting Result
I’ve also looked at the betting result, if you use the Kelly Criterion on the game projections. I’ve used 0.3 as the multiplikation, and I’ve bet all edges. This is the result, where I’ve differentiated between Static and dynamic bankroll. Static means that you bet the same amount, no matter the previous results. Dynamic means that the bet size depends on the previous results. So, if your bankroll is above the starting point the bet size increases. If your bankroll is below the starting point the bet size decreases.
Here’s how my model did:
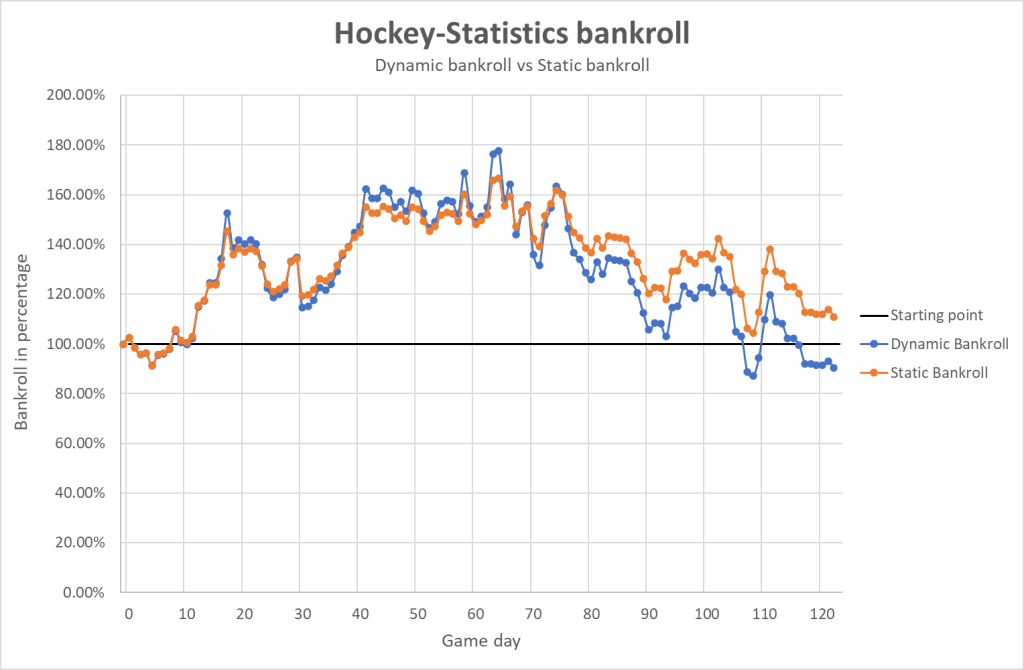
The first half was really good, while the second half was poor.
I also did this for The Athletic and BayesBet:
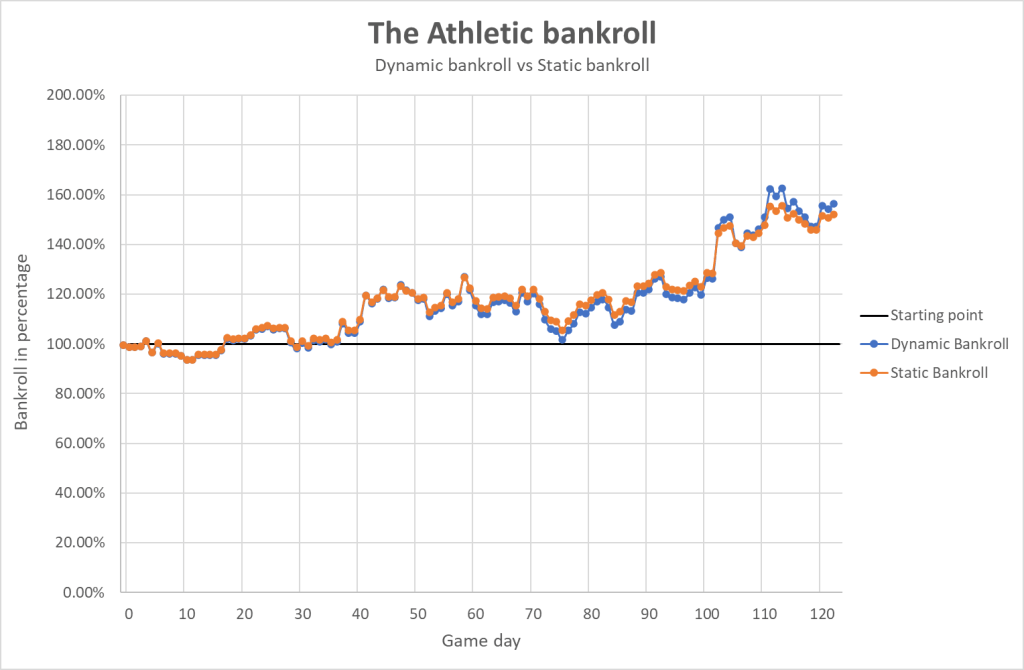
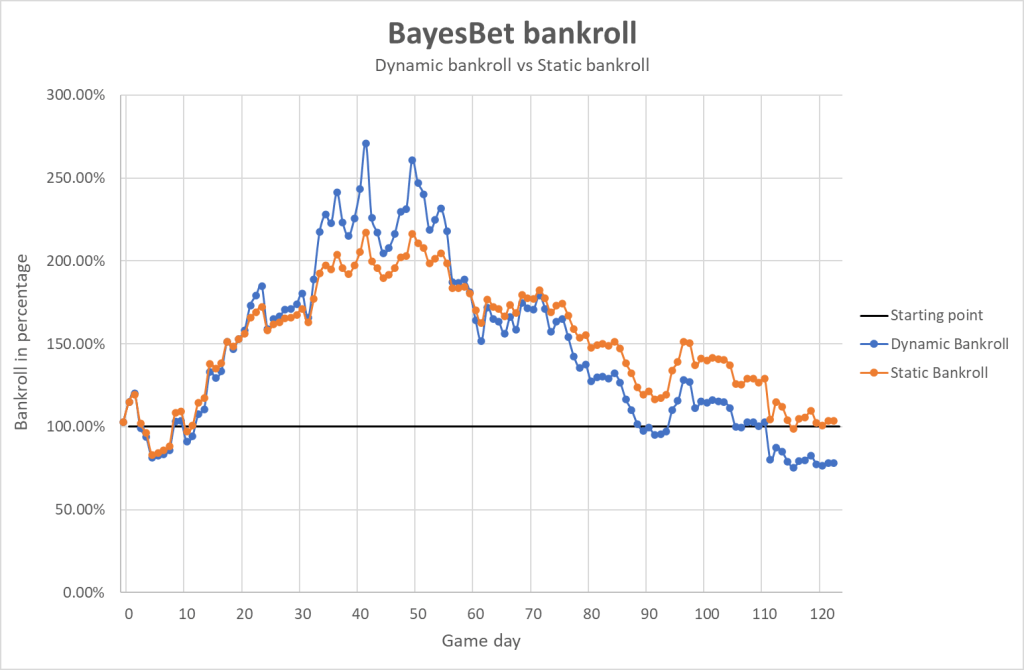
BayesBet and my model started off much better, but ended up with worse results than The Athletic.
Finally, we can look at the overall betting result for the three models:
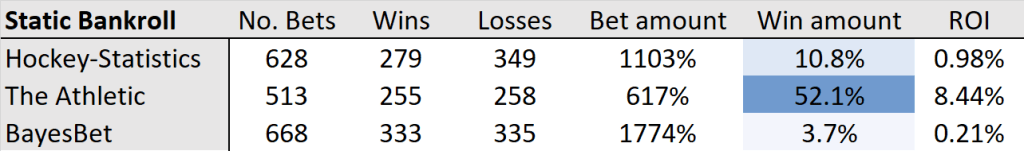
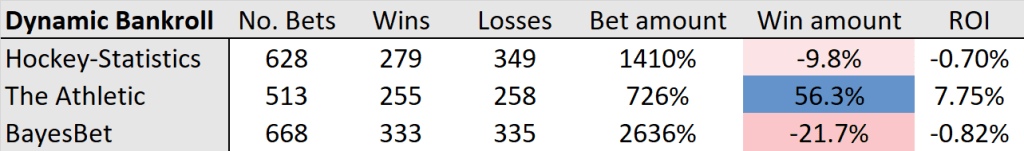
It’s worth noting that The Athletic had the lowest betting amount. This means that the game projections of The Athletic generally were closer to the implied odds.
You can download the spreadsheet with the betting results here.

Reblogged this on Hockey-Statistics.
LikeLike