
This article is written by Chris from ImPCT Sport. Follow them on Twitter: @ImpctSport. Here’s the previous articles written by ImPCT Sport:
Lineup deployment management is a subject of debate in the sport community. By lineup deployment, I mean the manner in which ice time and starts are divided (or spread) between players during a game. Should teams score by committee? Or rely on a heavy top 6 to provide offence? And do using defensive specialists actually work? In the present, I set to study the team deployment strategy that yields the best game outcome, whether sharing deployments evenly between players, or relying heavily on a subset of players.
Game Deployment using the ImPCT Engine
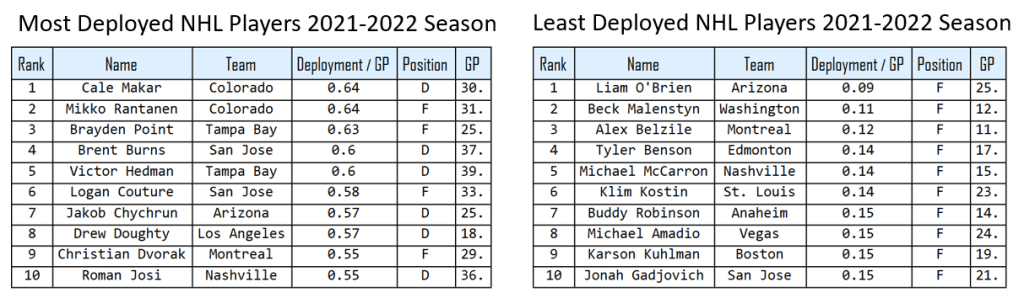
In a previous post, I explained how we measure player deployment (or Game Impact) using machine learning, and more specifically the ImPCT engine. Since different teams deploy their lines differently, hence not all 1st line forwards in the league have the same deployment (“Game Impact”). This is why using Machine Learning, we measure a deployment level by the predictivity power of a player to predict a game loss or win. The deployment value of each player is recorded (usually between 0 and 1) and used as an indication of the level of deployment of the player for a game. The higher the value, the more the player was deployed in the game (More time on ice, starts, etc..). For instance, the following are the top 10 most deployed and least deployed NHL players so far for the 2021-2022 season as measured the ImPCT:
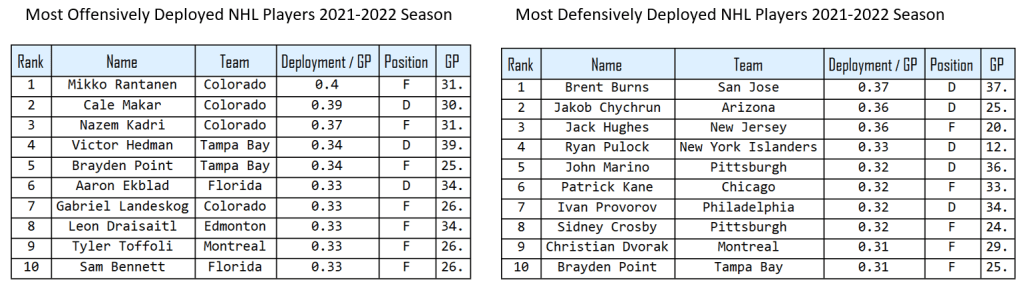
Furthermore, the deployment value of a player can vary whether on the Overall performance of the player, or the Offensive/Defensive performance. Based on the offensive or defensive zone deployments, or time spent on the power play or penalty kill, the deployment level of a player can differ between offence and defence for the same game. Bellow are the top NHL 2021-2022 Offensively and Defensively deployed players:
Standard Deviation of the Deployment Level
The Standard Deviation of a sample is a measure of the dispersion within that sample. In the present, in order to measure the team deployment strategy, I calculated the Standard Deviation of the Deployment Levels for each team’s games played. The smaller the standard deviation of the deployment levels for a game played, the more players were deployed similarly. On the opposite, a larger standard deviation indicates a greater dispersion of the deployment levels. Put simply, a team playing by committee will yield a smaller standard deviation of the deployment levels whereas a top heavy team will yield larger standard deviation values.
Empirical Simulation
In a first instance, I calculated the relationship between the Standard Deviation of the deployments and the point % gained by the teams for the 2021-2022 NHL regular season. The results are plotted hereunder. In this instance and to my surprise, the deployments strategy (shared deployments or top heavy) had no relationship with the point % gained by the team. Hence, the data indicates that whether the deployments are shared evenly between players or not doesn’t yield better or worse results for teams.
NHL 2021-2022 Season
0.63226 + 1.8735x

Offensive and Defensive Deployments
In a second instance, I measured whether lineup deployment factorized into Offence and Defence impacts game performance. The results are shown hereunder:
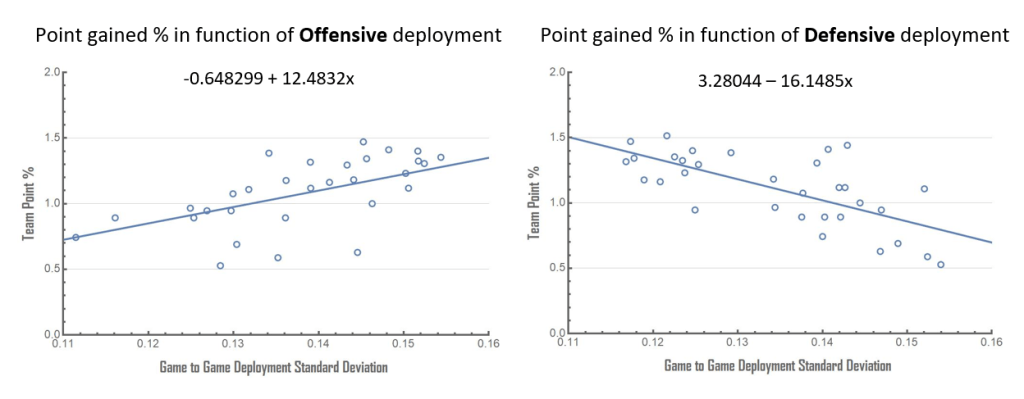
In this instance, the results showed opposite relationships whether offensively or defensively. On the offensive deployments, a large spread in offensive player deployments yield better results than smaller deployment spreads (i.e. scoring by committee). This seems to indicate that teams relying on specific players to provide offence showed better results than the teams that used the scoring by committee strategy.
However on the defensive deployments, the opposite is true where teams defending by committee showed better game performance than teams relying on specific players to defend. In summary, on the offensive side, a larger spread in offensive deployments yields better results whereas defensively, defending by committee shows a better outcomes.
I then wondered if both deployments can be managed differently. For instance, can a team use large deployment spread offensive, but still defend by committee? This is what I set to explore in the following section.
Offensive and Defensive deployment strategy
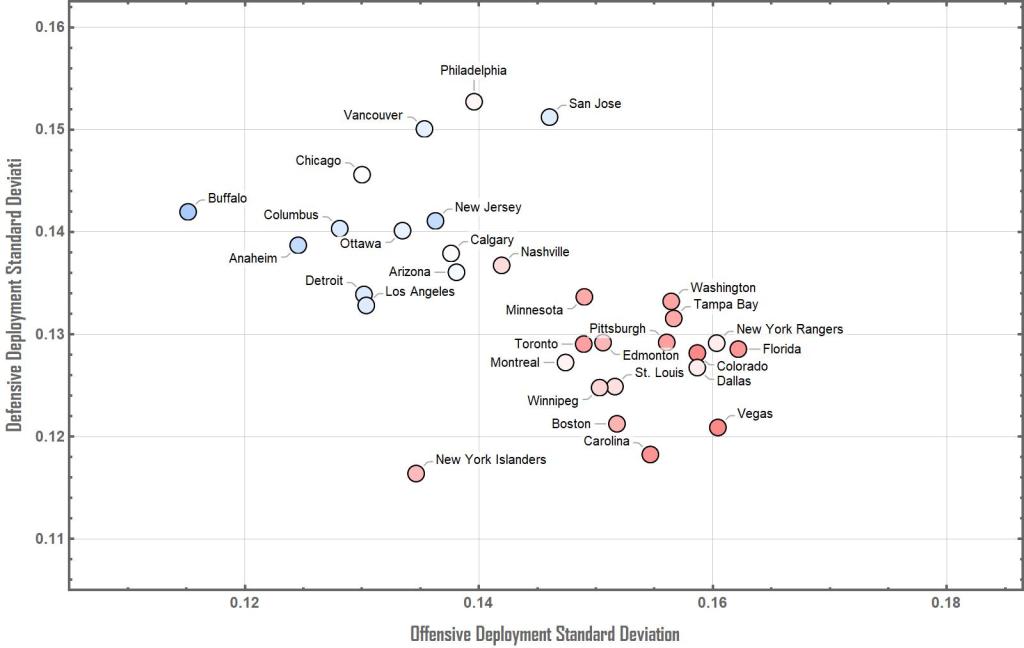
The following shows a map of all NHL teams for the 2021-2022 season on the Standard Deviation of the Offensive and Defensive Deployments. Furthermore, the data points present a colour code in function of the point % gained by the team. Red data points indicate positive point % teams whereas blue point indicate Negative point % teams.

Results show an interesting trend where large offensive spread and small defensive spread seems to be the strategy that yield the best results. However, Colorado shows, with success, large spreads in deployments both offensively and defensively. To the opposite, Calgary and Nashville are teams with small spreads both offensively and defensively. I further analysed the NHL 2020-2021 season to verify if it would show similar results. The results are plotted hereunder:
The 2020-2021 season results show a similar trend, however data points are more clustered together as opposed to the 2021-2022 data. An interesting team from the 20-21 season is the New York Islanders that, with success, put together a team structure that played by committee both offensively and defensively. Finally, I plotted the same metrics for the QMJHL, results are shown bellow:

Conclusion
The data showed an overall similar trend, where high offensive deployment spread, and low defensive deployment spread seem to be the strategy that yields the best results. I have been wanting to study team player deployment strategy an its impact on game outcome for some time now. The present shows some interesting trends, and offensive/defensive deployment spread does seem to have an affect on the game outcome, where some deployment strategies are preferable to others. However, studying deployment in that manner fails to prove the causality and the direction of that relationship. For instance, does a low offensive deployment spread (scoring by committee) really yields bad game results, or do struggling teams choose this strategy by lack of options. A different type of analysis is required to to establish causality and the direction of the relationship.
