After I published the last article, I had a great conversation @IanGraph. Based on this conversation, I’ve decided to make a follow-up article.
The main question is: Why does my findings on predictability differ from other research on the subject?
Tests typically show that corsi and expected goals are better predictors than actual goals. However, in my findings goals are a great predictor of future results. Why is that?
Research from @Draglikepull
Here’s some research by @Draglikepull on the predictiveness of goals, corsi and expected goals. In the first article he looks at CF%, xGF% and GF% (only 5v5 data) in the first half of the season. He then looks at how each metric correlate with 5v5 GF% in the second half of the season. So, basically he tests how well CF%, xGF% and GF% in the first half of the season predict GF% in the second half?
In the second article the split is even games and odd games instead of first half/second half.
Corsi vs xG, Part 2 – Draglikepull’s hockey research (greatapes.ca)
The results show that corsi is a slightly better predictor than expected goals and a much stronger predictor than actual goals. This is different from what I found in my previous article.
The goal of this article isn’t to discredit the work of @Draglikepull in any way. There’s absolutely nothing wrong with the research and I’ve come to similar conclusions myself. So, the question is: Why do the two different methodologies lead to such different results?
Differences between the test methods
Before we can answer the question, we need to determine the differences between the methods. The way I see it, my method differs in three ways:
- Weighing of the variables (e.g. [D CA], [F CF])
- Using player stats rather than team stats
- The model output is single game log loss instead of half season GF%
I will go through each of these differences step by step.
Weighing of the variables
In my method I divide each metric (e.g. corsi) into four sub-metrics – defender CA, defender CF, forward CA and forward CF. Then I optimize/weigh each sub-metric before combining them. So, there is a difference between Combined Corsi (from my test) and straight up C+/-.
This was my argument when I discussed it with Ian Tulloch. I thought weighing the sub-metrics would have a small effect on corsi and a great effect on goals and expected goals. Thus, explaining the difference between my results and @Draglikepull.
However, when I tested this theory, I found a very limited difference between combining the weighed sub-metrics and just using the parent metric. Here are the results:
| Log loss | Weighed | Not weighed |
|---|---|---|
| Corsi | 0.68117 | 0.68116 |
| Goals | 0.67896 | 0.67901 |
| xGoals | 0.67942 | 0.67940 |
This made me wonder if I should try and re-evaluate how I weigh the sub-metrics. The weighing was made solely based on where the predictability was largest (finding the x-value with the lowest corresponding log loss). But I didn’t weigh the sub-metrics based on how predictable it was – how low the log loss value was. To try and account for this, I also weighed the variables based on delta log loss (dLL):
dLL(Variable) = LL(Base) – LL(Variable)
e.g. dLL[D CA] = 0.68808 – 0.68381 = 0.00427
So, I added a weighing factor based on the dLL for one sub-metric compared to the total dLL of all the sub-metrics:
e.g. Weighing[D CA] = dLL[D CA]/(dLL[D CA]+ dLL[D CF]+ dLL[F CA]+ dLL[F CF]) = 0.2266
I added these additional weightings to all the sub-metrics. The results weren’t any better though:
| Log loss | x-value | x-value, dLL | Not weighed |
|---|---|---|---|
| Corsi | 0.68117 | 0.68116 | 0.68116 |
| Goals | 0.67896 | 0.67916 | 0.67901 |
| xGoals | 0.67942 | 0.67940 | 0.67940 |
In conclusion, the game predictions are equally good whether you use weighed sub-metrics or use the parent metric. If there’s no difference between the complex and simple methodology I will always recommend going with the simple version.
However, there’s still one thing to consider. The quality of the game predictions may not be impacted by the weight of the sub-metrics, but player strength and team strength may still be impacted.
So, now we have three different weightings of the sub-metrics.
- Sub-metrics weighed by where the predictability is largest (finding the x-value in the first article)
- Sub-metrics weighed by x-value and delta log loss (dLL)
- Sub-metrics un-weighed
And here’s all the weightings set up in a table:
| Sub-metric | x-value | x-value, dLL | Not weighed |
|---|---|---|---|
| D CA | -0.0001115 | -0.0001009 | -0.0000888 |
| F CA | -0.0000775 | -0.0000769 | -0.0000888 |
| D CF | 0.0001089 | 0.0001117 | 0.0000888 |
| F CF | 0.0000731 | 0.0000781 | 0.0000888 |
| D GA | -0.00172 | -0.00129 | -0.00147 |
| F GA | -0.00111 | -0.00081 | -0.00147 |
| D GF | 0.00199 | 0.00220 | 0.00147 |
| F GF | 0.00132 | 0.00155 | 0.00147 |
| D xGA | -0.00243 | -0.00211 | -0.00205 |
| F xGA | -0.00163 | -0.00157 | -0.00205 |
| D xGF | 0.00274 | 0.00288 | 0.00205 |
| F xGF | 0.00180 | 0.00201 | 0.00205 |
The general trends are: Weighing (1) increases defender metrics and decreases forward metrics Weighing (2) increases offense metrics and decreases defense metrics (especially for xG and G).
In terms of game predictions (game log loss), the difference between the weightings is limited… But it does matter in regard to player evaluation. I tried to illustrate the effect in the following table:
| Type | x-value | x-value, dLL | Not weighed |
|---|---|---|---|
| Good defender | ↑ | ↑ | – |
| Bad defender | ↓ | ↓ | – |
| Offensive defender | – | ↑ | – |
| Defensive defender | – | ↓ | – |
| Good forward | ↓ | ↓ | – |
| Bad forward | ↑ | ↑ | – |
| Offensive forward | – | ↑ | – |
| Defensive forward | – | ↓ | – |
A good player means he’s above average and an offensive player means the offensive sub-metric is larger than the defensive sub-metric (e.g. CF>CA). I’m not sure which weighing gives the best player data. I actually think it may be preferable not to weigh the sub-metrics for corsi, expected goals and goals.
Conclusion:
Weighing of the sub-metrics can’t explain the differences in predictability found by @Draglikepull and me.
Using player stats rather than team stats
In @Draglikepull’s test he uses team stats. In my testing I use on-ice player stats. This means that the team strength is dependent on the lineup.
In other words, for each player I use the on-ice stats for the previous 50 in-season games. Instead, I could just use the on-ice data of the team in the previous 50 in-season games. When I do this, the result becomes independent of the lineup in the specific game we’re testing.
Here’s the log loss results if we use team stats instead of player stats:
| Log loss | x-value | x-value, dLL | Not weighed | Team stats |
|---|---|---|---|---|
| Corsi | 0.68117 | 0.68116 | 0.68116 | 0.68097 |
| Goals | 0.67896 | 0.67916 | 0.67901 | 0.67893 |
| xGoals | 0.67942 | 0.67940 | 0.67940 | 0.67936 |
Surprisingly, there’s no real difference in predictability between using team stats and player stats. If anything the predictions are better, when we use team stats compared to player stats. If your game prediction model is solely based on on-ice metrics, then there’s no need to make it player-based – A team-based model will be just as good!
Conclusion:
Using player data doesn’t answer our question either. We still can’t explain, why the research on predictability differs.
From a model-building perspective it’s interesting that a team-based model performs as well as a player-based model. Personally, I’m still interested in building a player-based model though, because other than a game prediction model I also want the output to be a player evaluation tool. Therefore, the model must be player-based. Also, it must be player-based if I include individual points in the model (which is the plan).
Single game log loss vs. Multiple game GF%
I haven’t been able to answer the question yet, so the answer must be found in the test methodology.
In my testing, I’m interested in building a game prediction model, so I’m looking to predict the result of the next game. @Draglikepull is interested in predicting the rest of the season (multiple games).
The following graph stems from this article: Expected Goals are a better predictor of future scoring than Corsi, Goals | Hockey Graphs (hockey-graphs.com)
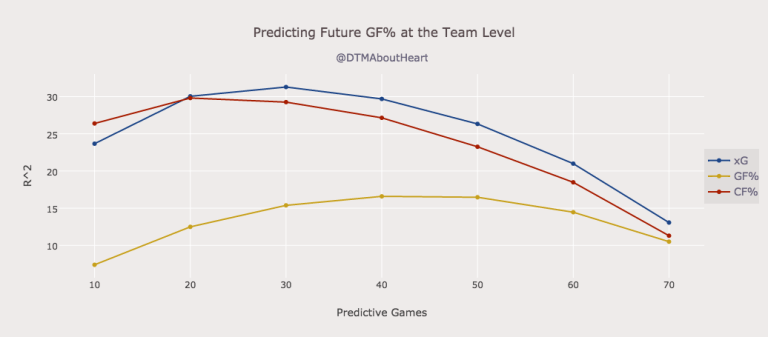
It shows how the predictability changes based on the number of predictive games. To the left you use 10 out-of-sample games to predict the remaining 72 games. To the right you use 70 out-of-sample games to predict the remaining 12 games. Clearly, the predictability of all three metrics is declining towards the end, but xGF% and CF% at a much higher rate than GF%.
In my test setup we’re using data from 50 games to predict a single game. In this setup goals are a better predictor than expected goals and especially corsi. I don’t think that is contradictory to the article from hockey-graphs.com.
Conclusion:
The predictability of on-ice metrics appears to depend on the output you’re interested in. If the goal is to predict the result of the next game, then the preferred metrics should be goals and perhaps expected goals. If the goal is to predict the results of half a season or a full season, then you should probably use corsi or expected goals as your predictor.
Perspective
This follow-up article became a lot longer than I expected, and I didn’t really get any further with my model-building. I still think this article provides some important insight on my methodology and the thought process behind it though.
Next up is combining the metrics to optimize the game predictions.
Data from http://www.Evolving-Hockey.com

2 thoughts on “Game projection model – The Variables (Part IB)”