
Abstract:
The goal of this piece is to discuss if it’s more important to have elite players (strong link) or great depth (weak link). To do so, I will look at talent distributions. How is the talent/impact spread out across the players? Do the elite players have a relatively larger impact on the game?
I’m using sGAA to measure talent, which is an arena adjusted model combined of GAR, xGAR and GSAx. You can read about the model here, and the arena adjustments here.
The model is not perfect, but it should give a good indication on how the talent is distributed amongst the players.
Talent distributions – Forwards:
Let’s start by looking at the forwards. I’m using career numbers (TOI>4000), because I want to determine how players can impact over a long period of time. Every year we see some surprise players having a career year, but I’m more interested in the players who are consistently performing at that elite tier.
So, here’s sGAA per 60 as a function of percentile. The best player is at 100% and the worst player is at 0%. The data consists of 505 forwards:
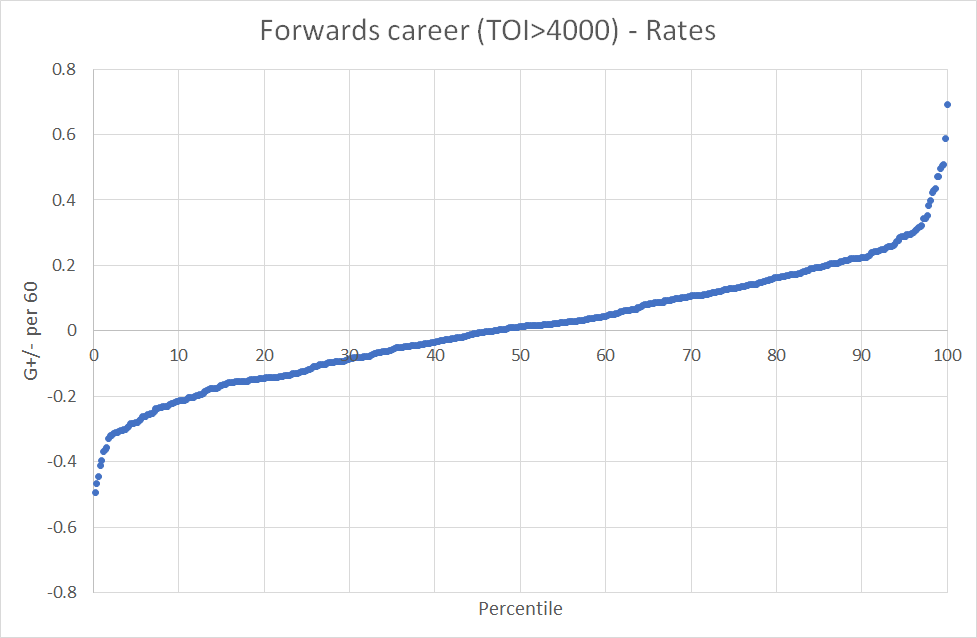
One could have expected the talent to be linearly distributed, but that is clearly not the case. The best players in the league absolutely have an increased impact on the game, but the same can be said for the worst players.
So, who are the players at this elite tier? Here is the top 10:
| Player | GP | TOI/GP | sGAA/60 | Rank | Percentile |
|---|---|---|---|---|---|
| Pavel Datsyuk | 589 | 19.9 | 0.693 | 1 | 100.00 |
| Connor McDavid | 351 | 21.5 | 0.587 | 2 | 99.80 |
| David Pastrnak | 390 | 17.3 | 0.508 | 3 | 99.60 |
| Sidney Crosby | 823 | 20.9 | 0.505 | 4 | 99.41 |
| Mark Stone | 449 | 18.9 | 0.497 | 5 | 99.21 |
| Brayden Point | 295 | 18.7 | 0.471 | 6 | 99.01 |
| Auston Matthews | 282 | 18.8 | 0.470 | 7 | 98.81 |
| Nikita Kucherov | 515 | 18.0 | 0.434 | 8 | 98.61 |
| Vladimir Tarasenko | 507 | 17.6 | 0.429 | 9 | 98.42 |
| Brad Marchand | 751 | 17.7 | 0.423 | 10 | 98.22 |
Nothing too surprising about this list. They are all players you would expect near the top. The surprising part is that the difference between Pavel Datsyuk (Rank 1, 100%) and Anze Kopitar (Rank 25, 95%) is the same as the difference between Anze Kopitar and Clarke MacArthur (Rank 268, 47%).
The elite players do have an incredible impact on the game, but the elite tier is very slim. We are just talking the top 2-3% before the curve starts flattening.
The worst forwards are almost entirely 4th liners with around 10 minutes of ice time per game.
We could also look at the sGAA contributions per game. This way we factor in the ice time:
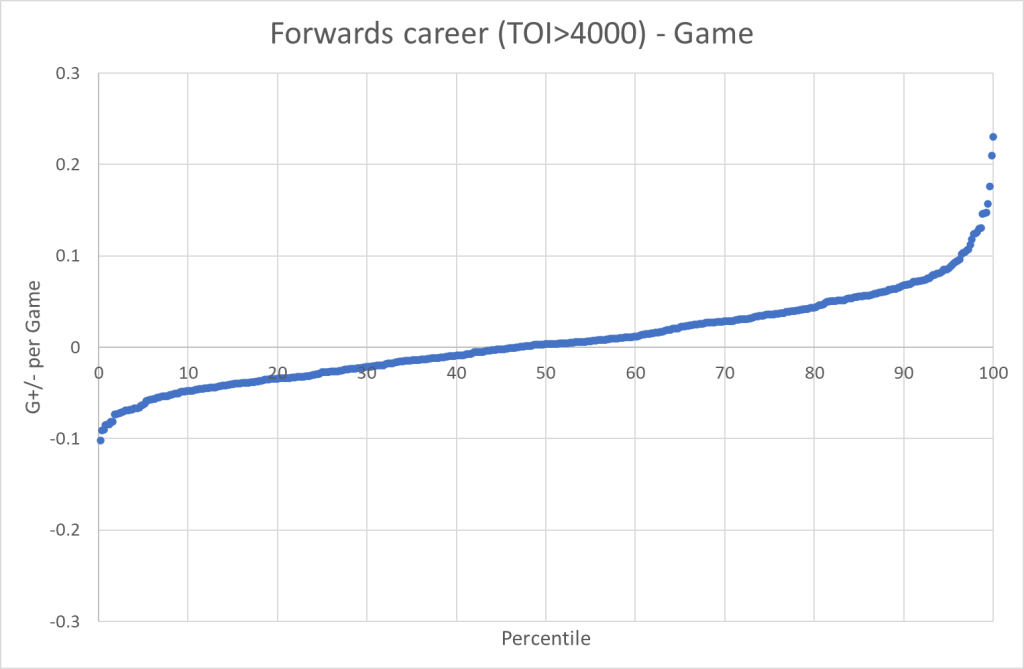
Now, we see the bad players have less impact while the good players have more impact. This is because coaches are pretty good at evaluating forwards, so the good forwards play a lot, while the bad forwards have limited roles – As it should be.
This can also be illustrated by looking at the correlation between TOI per game and sGAA per 60:

Talent distributions – Defenders:
A similar analysis can be done for the defenders, so let’s start by looking at the talent distribution based on sGAA per 60:
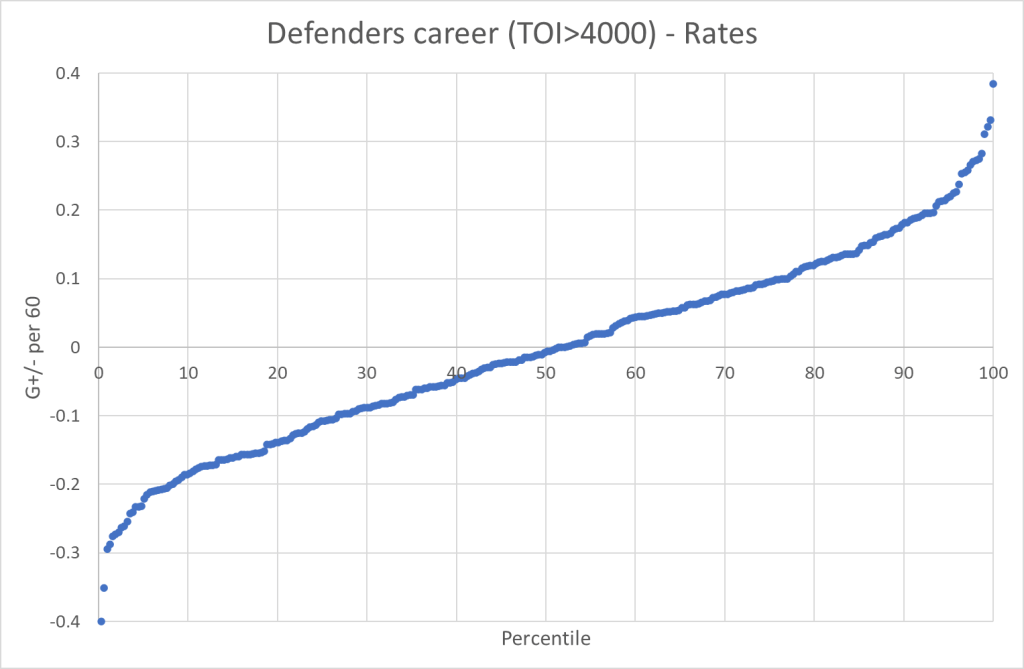
The talent is still not distributed linearly, but the extremities are perhaps a bit less extreme than they were for the forwards. The graph is almost symmetrical, indicating that the bad defenders are as bad, as the good defenders are good.
Here’s the top 10 best defenders according to my model:
| Player | GP | TOI/GP | sGAA/60 | Rank | Percentile |
|---|---|---|---|---|---|
| Ryan Ellis | 527 | 20.7 | 0.385 | 1 | 100.00 |
| Charlie McAvoy | 184 | 22.5 | 0.331 | 2 | 99.68 |
| Lubomir Visnovsky | 466 | 22.2 | 0.322 | 3 | 99.36 |
| Brian Rafalski | 291 | 23.1 | 0.311 | 4 | 99.04 |
| Jared Spurgeon | 653 | 22.4 | 0.282 | 5 | 98.72 |
| Colton Parayko | 386 | 21.8 | 0.274 | 6 | 98.40 |
| Dan Boyle | 606 | 23.6 | 0.273 | 7 | 98.08 |
| Jaccob Slavin | 377 | 22.7 | 0.271 | 8 | 97.76 |
| Ryan Pulock | 234 | 20.7 | 0.266 | 9 | 97.44 |
| Nicklas Lidstrom | 387 | 24.8 | 0.258 | 10 | 97.12 |
I’m well aware that this is not the consensus list, which is why I brought it up. It’s quite difficult to rank defenders and the GAR and xGAR models value some defenders very differently.
@JFresh wrote an article about Seth Jones (https://jfresh.substack.com/p/is-seth-jones-actually-elite) which explains some of the difficulties when it comes to evaluating defenders.
That was a bit of a side track. Just be aware that sGAA or any other model isn’t perfect. You will always need context and critical analysis as well.
Here’s the graph of sGAA per game:

There is no clear difference between the two graphs, indicating that ice time isn’t necessarily given to the best defenders. Again, there seems to be a mismatch between how the model values defenders and how coaches value defenders. This is also what we see, when look at the correlation between TOI/game and sGAA/60.
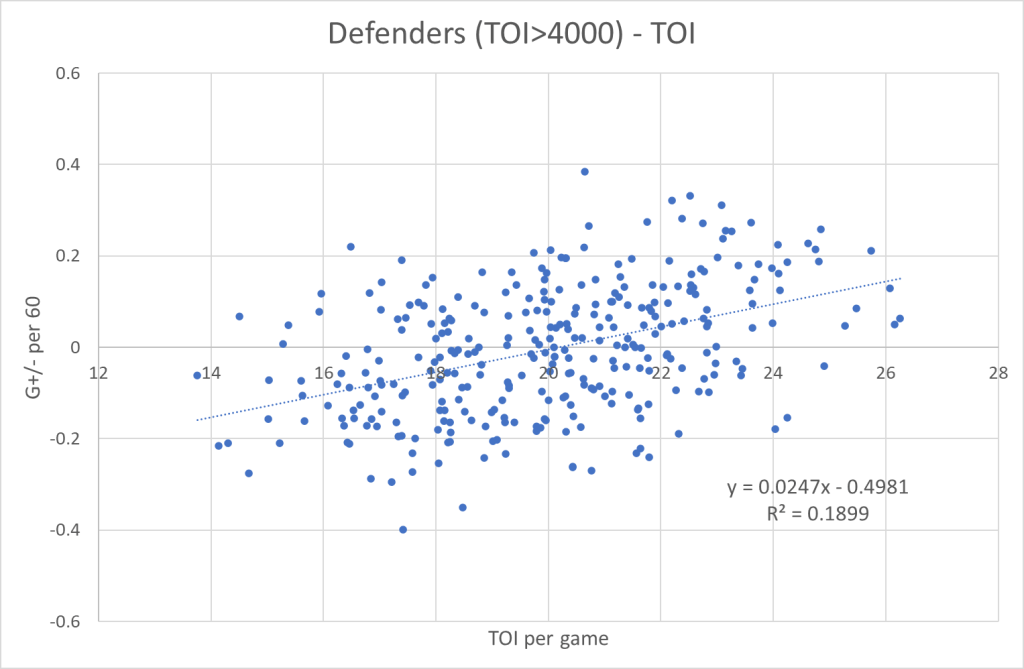
I don’t think you can hide a bad defender on the 3rd pairing the same way you can hide a bad forward on the 4th line. Even on the 3rd pairing most defenders play 16+ minutes, so a bad defender will cost you more than a bad forward.
Talent distributions – Goalies:
Finally, we get to look at the goaltenders. The worst nightmare of every statistician. The approach is the same as before. We start by looking at career rates:
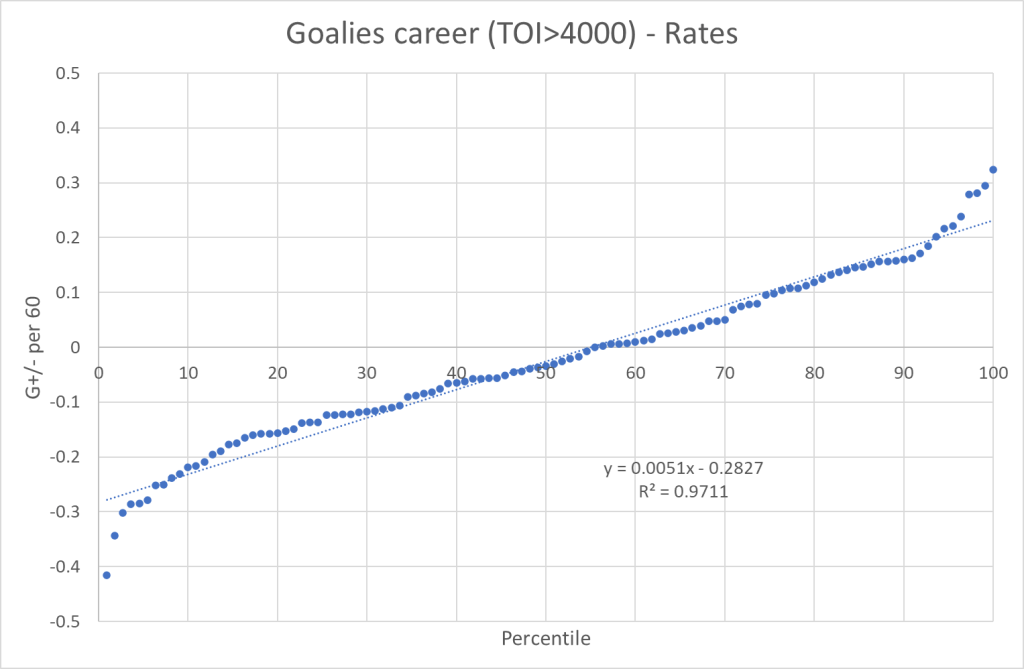
I’ve added a trendline to show that the distribution is primarily linear, and most of the goalies at the top or the bottom have relatively short careers (around 100 games), so they may not have regressed to their natural level yet.
So, the difference between goaltenders isn’t as big you might think – at least not when we’re looking at career numbers. A great goaltender saves a goal every 4 to 5 games throughout his career, and a bad goalie will cost you about the same.
But what happens if we look at single season data? If we look at the sGAA per 60 for every season where a goalie plays more than 1000 minutes, then the result is very different:
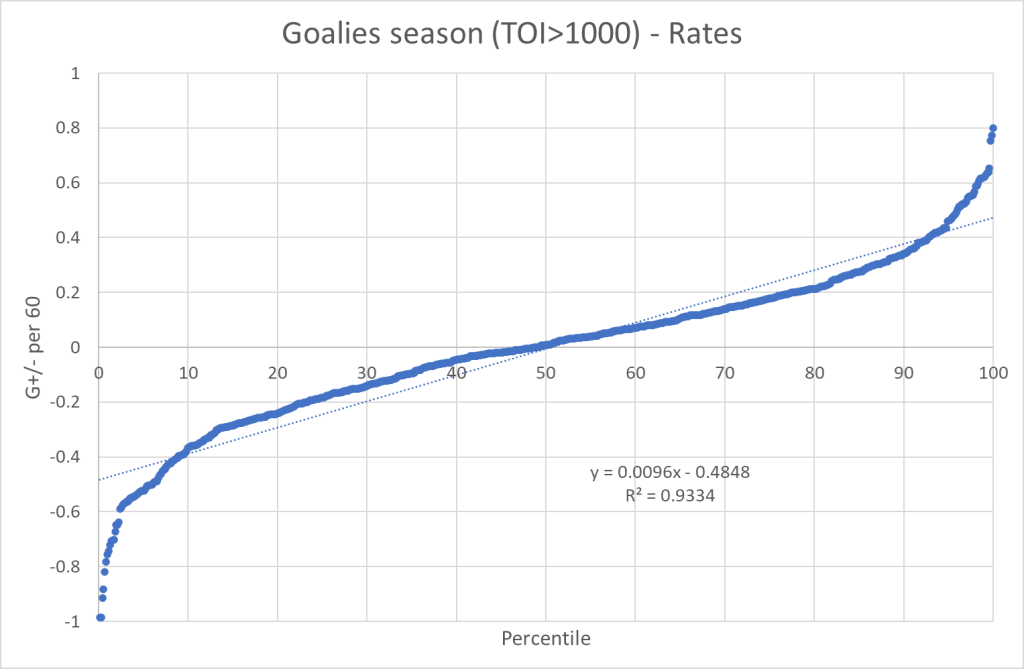
Now we see goalies almost costing a goal every game, as well as goalies saving close to that amount. This is more in line with the perception of goaltending. On a single season basis there’s huge differences between goaltenders.
Why can a goaltender win the Vezina one year, only to be replacement level the next? This is the question that should keep you up at night.
I’m not ready to say it’s just variance – that goaltending is voodoo! I don’t believe a great goaltender can become awful in one year. There’s something the goaltender metrics aren’t getting.
The key to great modelling is to make goaltending more repeatable. Adding the Arena Effects was one step in the right direction, but there’s still a long way to go. Current public data probably won’t get us there.
Discussion:
So, is NHL a strong link league? I don’t know – Maybe.
There is a small elite tier of players that has an incredible impact on the game, but I still think you still need a good balance. A few really bad apples can completely off set an elite player.
90% of the talent is linearly distributed. Make sure you find value for money in this region, and for the love of God do not deploy a player from that bottom 2-3%. They will cost you.
Overall, I think depth on defense is more important than depth on forwards, since you can easier hide a bad forward. Regarding goaltenders you should probably not make decisions based on a single season. Things tend to even out over time.
Perspective:
When it comes to predicting future outcomes, you will generally want to weigh the data, so you put most weight on current results. However, goaltending seems to have a very large variance, so perhaps you should weigh goaltender data more evenly. Just a thought for later.
No model is ever going to be perfect. Great analysis isn’t about finding all the answers. It’s about asking the right questions.
All stats from www.evolving-hockey.com
