Abstract
The event data by Stathletes for the Big Data Cup is very detailed. This should allow us to determine when (time), where (coordinates) and how (event) a player gains possession of the puck. Likewise, it should be possible to determine when, where and how a player losses possession of the puck. In other words, we can transform the data into possession data. All possessions should contain a start event and an end event.
By transforming the event data into possession data, we get a few new variables: Possession time (time between start event and end event) and possession/carrying distance (distance between start event and end event).
The hope is to get a more holistic player/team evaluation, by not just looking at the events but also what occurs between the events. We’re not just interested in “what happened” but also “how fast did it happen”.
Theory
I believe all plays can be described as a three-step process: Perception -> Decision making -> Execution:

Typically, perception and decision making are viewed as one skill that we call Hockey IQ. However, I think it’s important to split it up, because it’s two different skills. You’re not necessarily good or bad at both.
The other important aspect of this theory is time. The quality of a player is not just determined by the quality of each step, but also the quickness of each step. If you think fast and play fast, there’s a good chance you can execute your play before pressure comes. Anyway, this isn’t the forum for an in-depth discussion of these concepts, but this is what inspired me to look at possession times.
All statistical analysis normally focuses on “what happened” (decision making) and “what was the result” (execution – did the shot go in? Was the pass completed?). In this project, I will try and introduce the concept of “how fast did it happen”.
Data preparation
For this project I’m working with the PWHL event data. This data is designed to describe events, but I want to focus on possessions instead. So, the first task is to transform the event data into possession data.
The goal is to have a dataset where all possessions consist of exactly two events – A start event and an end event. To get there, I did the following:
- Remove zone entry events – For this project I’m not focusing on zone entries, and I should be able to find entries and exits directly from the possession data anyway.
- Add receptions – For all possessions to have a starting event I need to add receptions. So, all completed plays (passes) are followed by a reception. I set the time of the reception to be the same as the time of the pass.
- Add deflections – If a shot is deflected then the first shot is counted as a missed shot, but the deflection is also counted as a shot. I don’t want deflected shots to be double counted, but I’ll get to that later. For now, I just need to add a start event between the two shots, so we know a new possession started.
- Add puck losses – Not all possessions have an end event. So, I added a puck loss event whenever a possession ended without an actual event.
- Add Faceoffs – Similar to puck losses, but now the next event is a Faceoff win rather than a puck loss. This could happen with offsides, period ends, puck out of play etc. – An icing would typically come after a dump in/out, so those possessions would already have an end event.
With these changes made, all possessions now consist of exactly two events – A start event and an end event. Before I transform the data into possession data, I want to specify some events though:
Plays (passes) that lead to shot within 2 seconds of reception is defined as a shot assist.
I also split shot events into 4 categories: Shot (shot on net), Missed (shot that misses the net), Blocked (shot that is blocked) and deflected (shot that is deflected).
When I’m doing shot analysis, I’m not including deflected events. I still count the actual deflection, but not the original deflected shot. The event “deflected” is more like special type of “shot assist”.
That was a lot of data preparation, but now the data can be transformed into first player possession data and later team possession data.
You can download all the data in this file: Event and Possession data
Start event types:
Puck recovery, takeaway, reception or deflection.
End event types:
Play, incomplete play, shot assist, dump in/out, goal, shot, missed, blocked, deflected, puck loss or face off.
Data concerns
This dataset is not designed to be possession data, so we need to discuss potential problems. The biggest problem is that there is a lot of time unaccounted for. In other words, there’s often time between one possession ends and the next one starts. Some off this can be explained. For instance, if a shot is taken and the goaltender covers the puck, then there will be some time between the shot is taken and the puck is recovered from the following faceoff.
However, this can’t explain everything. My assumption is that nothing really important happens between possessions. Or else we would see events there. It’s still something to be aware of.
Just know that possession time doesn’t equal playing time.
Data interpretation
With all the boring data preparation out of the way, we can now start interpreting the data. I will look at the data from 4 angles: General player possessions, Specific player possessions, General team possessions and finally Specific team possessions.
General player possessions:
Let’s start of by looking at 5v5 possession times based on position:
| Position | #Possessions | Time (s) | Average Time |
|---|---|---|---|
| D | 5062 | 8845 | 1.75 |
| F | 7114 | 16293 | 2.29 |
| G | 144 | 62 | 0.43 |
Forwards have longer possessions than defenders. Goaltenders unsurprisingly have very short possessions – stopping and playing the puck mostly behind the net.
Next, we will look at starting zones (5v5):
| Position | Defensive | Neutral | Offensive |
|---|---|---|---|
| D | 60% | 19% | 22% |
| F | 33% | 26% | 41% |
| G | 100% | 0% | 0% |
Defenders start a very large percentage of their possessions in the defensive zone. This may not be too surprising, but it could be an indication that teams aren’t very good at activating the defenders in the offensive zone.
Average possession times depending on starting zone (5v5):
| Position | Defensive | Neutral | Offensive |
|---|---|---|---|
| D | 1.88 | 1.64 | 1.47 |
| F | 2.27 | 2.77 | 1.99 |
| G | 0.43 |
We see that possessions starting in the offensive zone is shorter than possessions starting in the neutral or defensive zone. This is a good indicator that time and space is limited in the offensive zone.
Passing stats based on position (5v5):
| Position | Incomplete Play | Play | Shot Assist | Incomplete Play | Play | Shot Assist |
|---|---|---|---|---|---|---|
| D | 1356 | 2168 | 85 | 38% | 60% | 2% |
| F | 1521 | 2162 | 390 | 37% | 53% | 10% |
| G | 14 | 115 | 11% | 89% | 0% |
We see here that defenders and forwards have very similar completion%, but forwards have a much higher shot assist%.
Average possession times based on position and event type (5v5):
| Position | Dump In/Out | Puck Loss | Incomplete Play | Play | Shot assist | Shot attempt |
| D | 1.40 | 3.68 | 1.67 | 1.83 | 2.29 | 1.73 |
| F | 1.72 | 3.87 | 2.11 | 2.10 | 2.52 | 2.03 |
The puck loss times are much longer than the other events, but we can’t conclude that puck losses occur when the player hold on to the puck for too long. Puck loss events are added by me when there was no other end event and I set the time to be the same as the new possession started. However, that’s not necessarily true.
It’s also worth noting that shot assists have longer possessions times than other passes. This could indicate that holding on to the puck will draw players to you, and you may be more likely to set up a shot.
Shooting stats:
I would also like to analyze how possession time affect shots. Here’s the shot distribution based on possession time (All strengths):

The line indicates the goal percentage of total shot attempts (CSh%). We see that, shots taken within one second has a significantly larger chance of going in.
Next graph shows the shot distribution in terms of percentages:
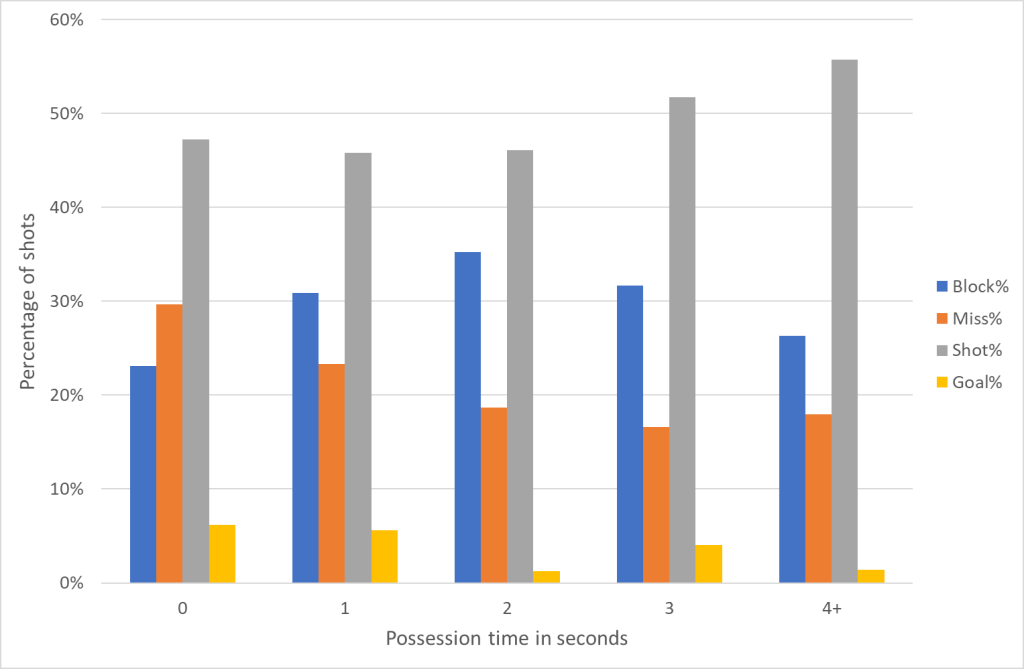
First timers (0 second shots) have a larger chance of missing the net, but also a smaller chance of being blocked. Overall, shots taken after 4+ seconds have a larger chance of hitting the net (grey column), but the difference isn’t that big.
It seems fair to conclude that shooting quickly is the best way to go. Then you don’t give the goaltender (and defenders) time to react.
Specific player possessions:
There are of course many more things you can look at in terms of general player possessions. I’ve merely scratched the surface here, but let’s move on to player specific possessions.
I’ve put together the player data in this file, but I won’t go into detail in this paper. Instead, I’ve created a player card visualization. You can find an online version here or download the cards here.
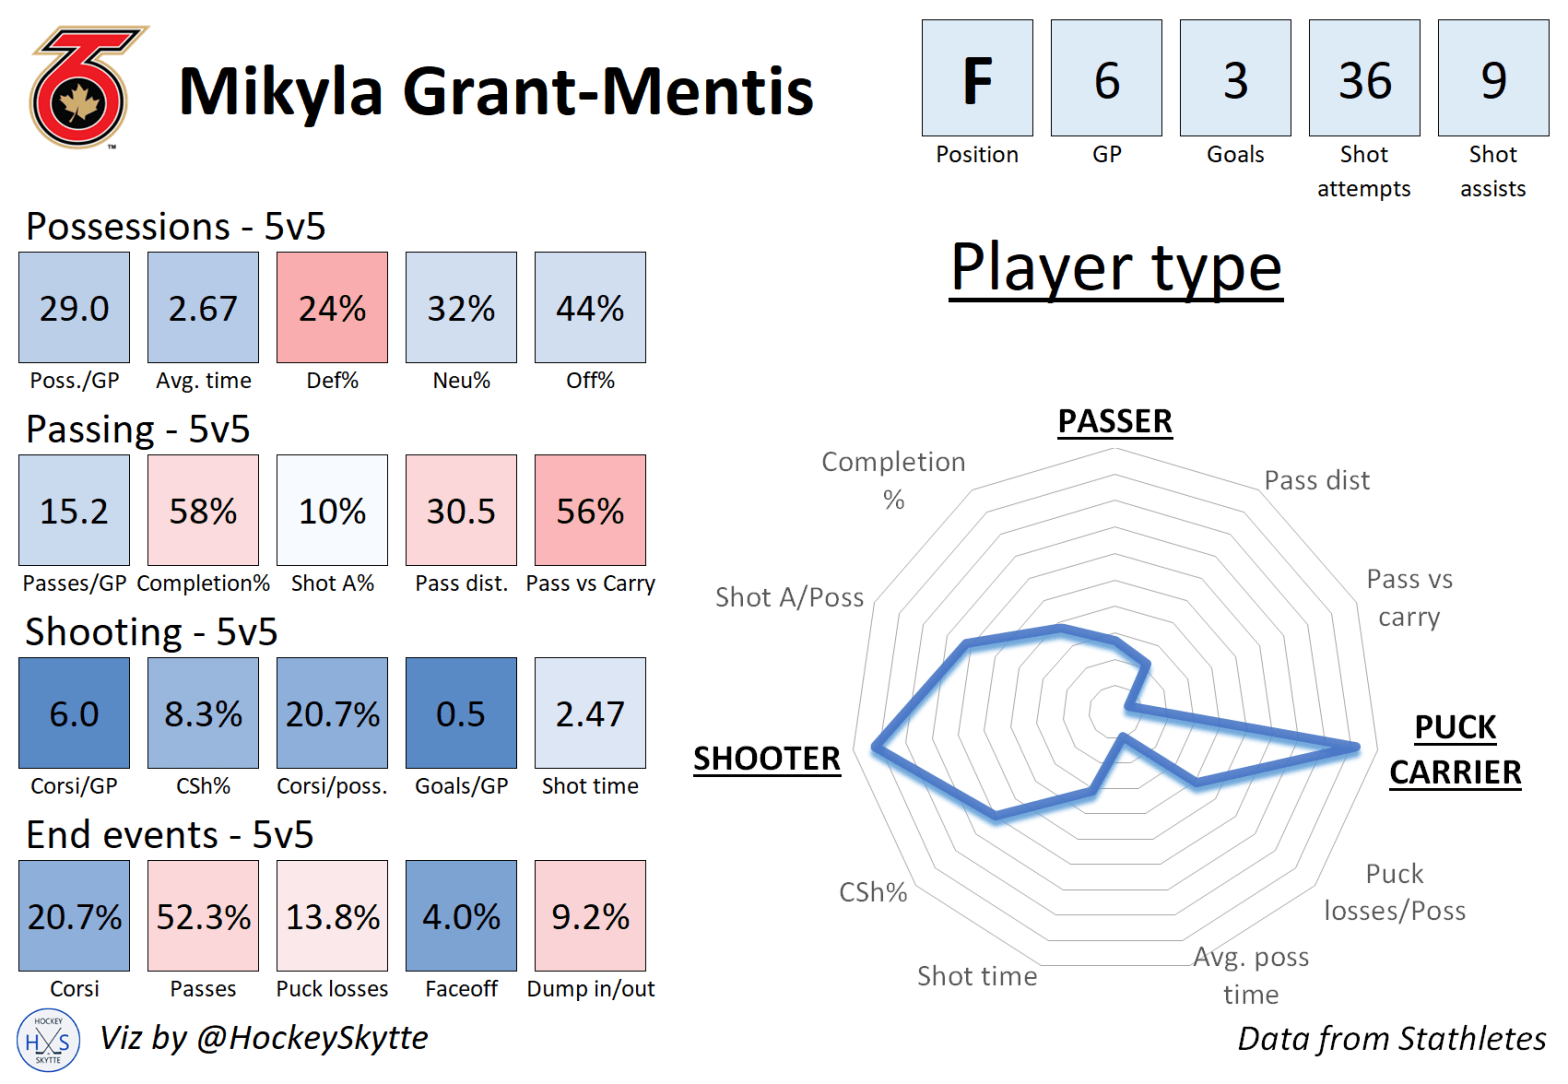
Player Cards:
I’ve made this card explainer:

In this example we have Janine Weber. She’s a shooter and a puck carrier. 53% of her possessions start in the offensive zone and 23.1% of her possessions end with a shot.
The player type graph can be split into 4 categories:

In this example (Julie Allen, F) we see a passer. She rarely carries the puck, and she almost never shoots. Because she doesn’t carry the puck, she has a low average possession time (high speed). For a player type like this you would like to see a higher shot assist rate.
That will be my short introduction to the player cards – feel free to browse around.
General team possessions:
Here’s the team positions based on starting zone. The last column shows the percentage of possessions that ends up becoming a goal (5v5):
| Start zone | #Possessions | Percentage | Goal% |
|---|---|---|---|
| Defensive | 3223 | 56.7% | 0.56% |
| Neutral | 1239 | 21.8% | 1.05% |
| Offensive | 1224 | 21.5% | 1.23% |
| Total | 5686 | 100.0% | 0.81% |
I’m surprised that almost 22% of all team possessions start in the neutral zone. I doubt the percentage is that high in the NHL. Unfortunately, I haven’t watched much Women’s hockey – maybe teams play with higher risk in the neutral zone (less dump ins).
We also see that a team possession starting in the offensive zone is twice as likely to end up with a goal than a possession starting in the defensive zone.
Here’s the average number of player possessions (pP) per team possession and the average possession time:
| Start zone | Average pP | Average time | Average pP on Goal | Average time on Goal |
|---|---|---|---|---|
| Defensive | 2.21 | 4.79 | 3.89 | 9.94 |
| Neutral | 2.01 | 4.02 | 3.00 | 7.54 |
| Offensive | 2.23 | 4.00 | 3.53 | 5.13 |
| Total | 2.17 | 4.45 | 3.52 | 7.70 |
The average team possession consists of 2.17 player possessions, but when a team possession ends up being a goal it consists of 3.52 player possessions on average.
Specific team possessions:
You can download the team possession data here. I’ve made team cards to visualize the team data. They can be found in an online version here or downloaded here.
Team cards:
Here’s a card explainer:
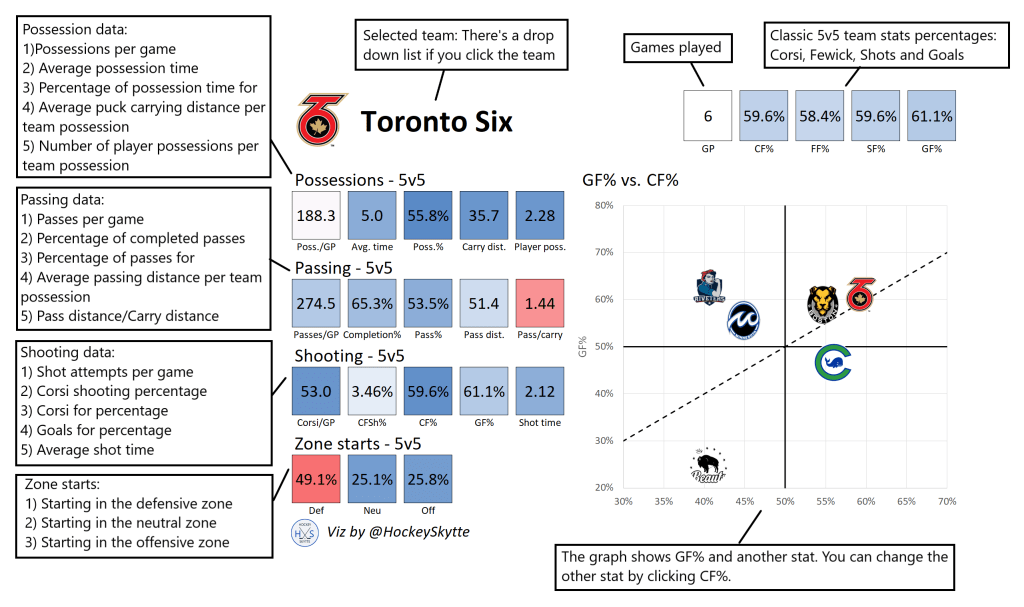
I won’t explain the cards in detail. Often, you hear CF% referred to as possession number. Now, you can see the actual possession number (Poss.% in the card). That’s the possession time relative to the possession time of the opponent.
Conclusions:
I think the idea behind this project was very simple – transform event data into possession data. I haven’t seen anyone do it before, though. So, while it’s a simple approach it’s also an original approach.
My research here is just the tip of the iceberg. Hopefully it will inspire others to dig deeper.
I really like how the player cards turned out. Even as they are right now, I think they could be a very helpful tool for coaches and GMs.
Perspectives:
Where can we go from here:
- It would be fun to combine the possession data with TOI and on-ice statistics. This way we could look at possession time per TOI or team possession time per TOI. We could get actual possession numbers for each player instead of relying on corsi numbers.
- I would also like to look at change in the y-coordinate on shot assists (how much does the goaltender have to side move).
- Future xG-models could include shot times and changes in y-coordinates.
- Transform the Olympics event data into possession data.
- Use this kind of analysis on NHL data. You can’t do this from the public PBP data, but I wonder if Corey Sznajder’s tracking data is detailed enough.
Data from Stathletes

One thought on “BDC 2022 – Transforming Event Data Into Possession Data”