
Before we get to discuss teams in more detail, I would like to make one last adjustment to the model. In the last blog I changed the model from a GAR model to a GAA model. I did this by using averages over the entire time frame. That gave this graph:

However, hockey has changed a lot since 2007, so that’s probably not the best approach. We want the average of the model (LS-GAA) to be 0 in every season, so that LS-GAA is directly comparable to actual goal differential.
Therefore, I have looked at the trends over time. LS-GAA in the table is the sum of every team and I have also added the team average.
| Season | GK | EV | PP | SH | PEN | LS-GAA | Team avg. |
|---|---|---|---|---|---|---|---|
| 07/08 | -256.4 | -147.2 | 129.9 | -11.8 | -2.0 | -287.4 | -9.6 |
| 08/09 | -218.5 | -80.6 | 109.9 | -12.7 | -1.0 | -202.7 | -6.8 |
| 09/10 | 21.6 | -107.0 | 61.0 | -7.8 | -0.6 | -32.8 | -1.1 |
| 10/11 | 89.8 | -115.4 | 37.7 | -4.8 | 0.0 | 7.2 | 0.2 |
| 11/12 | 71.1 | -71.2 | 1.4 | -1.5 | 0.3 | 0.1 | 0.0 |
| 12/13 | -39.4 | -152.4 | -17.2 | 7.2 | -0.1 | -201.9 | -6.7 |
| 13/14 | 70.9 | -17.3 | -7.4 | 8.1 | 0.4 | 54.7 | 1.8 |
| 14/15 | 118.8 | -39.0 | -43.2 | 12.0 | 1.2 | 49.8 | 1.7 |
| 15/16 | 217.3 | 68.5 | -42.0 | 9.9 | 0.0 | 253.6 | 8.5 |
| 16/17 | 188.9 | 141.7 | -49.8 | 8.1 | 0.2 | 289.2 | 9.6 |
| 17/18 | 17.5 | 150.2 | -64.2 | -1.8 | 0.1 | 101.9 | 3.3 |
| 18/19 | -108.3 | 174.5 | -61.6 | -2.4 | 0.4 | 2.6 | 0.1 |
| 19/20 | -173.3 | 195.2 | -54.6 | -2.6 | 1.0 | -34.4 | -1.1 |
What does this mean? It means, that an average team in 2007/2008 has a LS-GAA of -9.6 whereas in 2016/2017 an average team would have a LS-GAA of +9.6.
So what I have done, is I have adjusted the model on a yearly basis. This means that every number in the above table is now 0. This gives the following graph:

Here’s how to interpret the model with the yearly adjustments:
- LS-GAA is the sum of 5 components: Goaltending, Even strength (consists of an offense and defense component), Powerplay, Shorthanded and Penalties (drawn and taken).
- Every component is adjusted on a yearly basis, so if you’re above 0 in powerplay it simply means you have been an above average powerplay team that year.
- You always compare the performance of a team with the other teams in that same year.
With the new and final adjustments to LS-GAA, R-squared is now up to 0.9547. It also means that 79% of the time the model is within 10 goals of the actual goal differential, and the model doesn’t seem to overvalue or undervalue one specific team or one particular style of play.
The 2019/2020 season:
The following table shows this seasons results (so far). You can find each component: Goaltending, even strength offense, even strength defense, powerplay, shorthanded and penalties. I have also added the actual goal differential (goals from shootout wins are not included).
| Team | GK | EVO | EVD | PP | SH | PEN | Total | G+/- |
|---|---|---|---|---|---|---|---|---|
| BOS | 16.90 | 1.21 | 24.34 | 10.19 | 3.18 | 4.36 | 60.18 | 60 |
| COL | 7.33 | 27.40 | 15.13 | -2.17 | -1.64 | 6.61 | 52.66 | 46 |
| T.B | -5.06 | 29.70 | 17.80 | 6.10 | 2.73 | -0.36 | 50.92 | 49 |
| STL | 11.69 | 4.29 | 11.31 | 9.83 | 1.75 | 1.30 | 40.17 | 33 |
| PHI | 2.56 | 14.56 | 7.76 | 0.73 | 3.55 | 2.38 | 31.54 | 36 |
| PIT | -3.19 | 11.72 | 11.81 | 2.62 | 2.36 | 1.53 | 26.84 | 25 |
| CAR | 16.63 | 14.12 | -10.50 | 6.98 | 2.43 | -6.77 | 22.89 | 24 |
| WSH | -5.84 | 28.32 | -6.47 | -1.30 | 9.43 | -3.19 | 20.94 | 24 |
| VGK | -4.56 | 14.36 | 8.79 | 3.63 | -1.72 | -4.89 | 15.61 | 15 |
| MIN | -36.13 | 16.58 | 24.16 | 2.33 | 2.46 | 3.09 | 12.50 | 1 |
| NYR | 24.85 | 19.32 | -25.68 | 6.66 | -12.01 | -1.03 | 12.11 | 13 |
| EDM | 2.81 | -0.09 | -5.93 | 14.37 | -0.16 | 0.64 | 11.63 | 8 |
| DAL | 19.25 | -24.78 | 15.37 | 2.48 | 0.33 | -1.99 | 10.66 | 4 |
| ARI | 20.58 | -18.52 | 2.85 | -2.49 | 0.72 | 4.07 | 7.21 | 7 |
| VAN | 4.75 | 5.01 | -11.27 | 6.54 | -1.77 | 1.20 | 4.45 | 10 |
| NSH | -13.56 | 12.37 | 4.24 | -2.12 | 1.44 | 0.76 | 3.12 | -2 |
| MTL | -8.21 | 11.22 | 10.65 | -5.78 | -3.21 | -1.80 | 2.88 | -12 |
| TOR | -11.62 | 17.92 | -7.62 | 4.77 | 1.25 | -1.89 | 2.81 | 15 |
| CHI | 17.25 | 11.97 | -24.92 | -8.60 | -0.17 | 4.17 | -0.30 | -6 |
| NYI | 9.65 | -11.52 | 3.03 | -5.23 | 1.77 | 0.83 | -1.48 | -1 |
| CGY | -0.75 | -5.61 | 0.67 | 2.24 | -1.67 | -2.31 | -7.43 | -10 |
| CBJ | -4.73 | -22.83 | 21.17 | -7.86 | 5.15 | 1.38 | -7.73 | -3 |
| WPG | 21.04 | -10.82 | -20.29 | 3.33 | -3.86 | 2.50 | -8.10 | 12 |
| FLA | -13.53 | 15.87 | -10.95 | 1.21 | -5.68 | 4.11 | -8.97 | 4 |
| BUF | -11.72 | -13.50 | 8.71 | -7.24 | -2.59 | 3.83 | -22.51 | -22 |
| L.A | -2.93 | -24.59 | 0.52 | -4.06 | 1.15 | 0.03 | -29.88 | -32 |
| S.J | 1.09 | -18.74 | -8.31 | -3.95 | -1.69 | -6.29 | -37.88 | -45 |
| N.J | -11.51 | -16.59 | -13.77 | -3.88 | 6.05 | 0.07 | -39.63 | -39 |
| ANA | -2.35 | -17.69 | -13.79 | -7.72 | 1.68 | -5.07 | -44.96 | -43 |
| OTT | -14.56 | -14.67 | -10.94 | -9.59 | -4.98 | -2.83 | -57.56 | -48 |
| DET | -26.13 | -55.97 | -17.87 | -11.99 | -6.29 | -4.44 | -122.69 | -123 |
I won’t go into details about the numbers. Instead I have picked a few cases/teams to look at.
New York Islanders:
The reason I have picked the Islanders is because of Barry Trotz. Can my model help explain what happened with NYI from the 2017/2018 season to the 2018/2019 season?
To better show the development of NYI I’ve made a performance graph – Years along the x-axis and goal differential along the y-axis. On the year-scale I have used the year the season ended, so year 17 represents season 16/17 and so on.
“The blue line” is actual goal differential, “the grey line” is the goaltending contribution according to my model and “the orange line” are the contributions from the skaters. The sum of the grey and orange lines should equal the blue line if the model is correct

If you’re above the black line, you’re above average and you likely made the playoff. My focus today is the jump from year 18 (Doug Weight) to year 19 (Barry Trotz). According to the graph above, the improvement came entirely from goaltending. The team went from being really bad to become the best goaltending team in just one year. This seems like too easy an explanation. How much of that goaltending spike is due to team defense improvement?
The model also consists of an even strength offensive component and an even strength defensive component, so it’s interesting to see what happened with these in year 19. Here’s the performance graph of the even strength components:
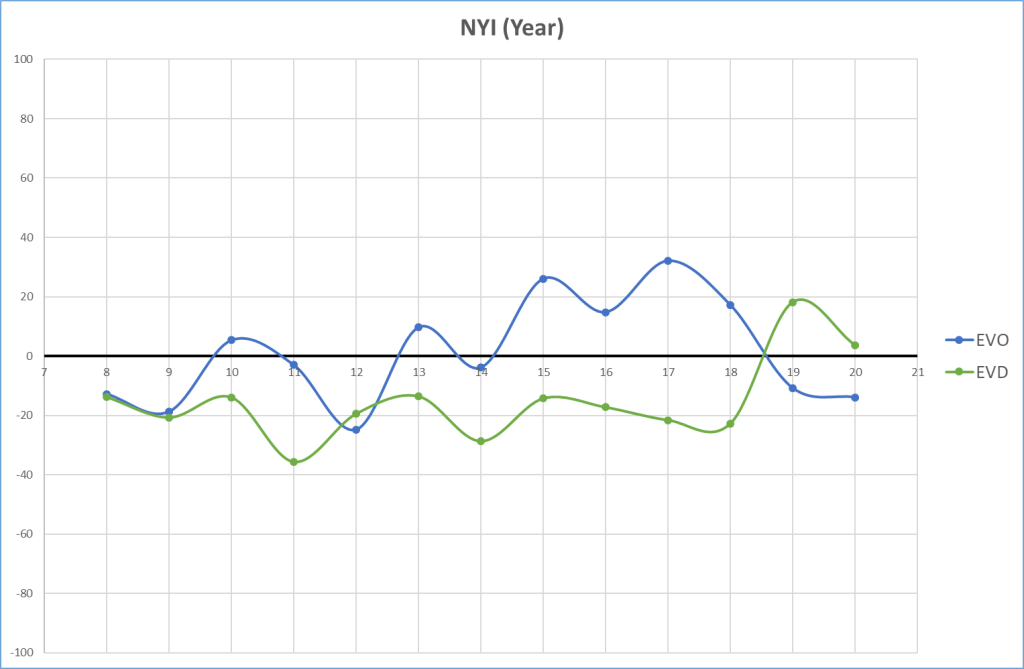
The overall even strength performance is almost unchanged, but offense and defense components have pretty much flip flopped. How much of an impact does this have on goaltending performance?
Statistics are rarely black and white, and they almost never tell you the entire truth. Combined with hockey knowledge and proper scouting, statistics can be a helpful tool though. In this case many stats people will say the performance of the 2018/2019 Islanders was 100% driven by goaltender performance/luck and it’s unsustainable. Islanders fans might say it’s entirely because of the coaching change and the improved defense, so it’s sustainable. The truth probably lies somewhere in the middle.
The final case in this blog will also be about goaltending. If you use GSAx as your goalie metric, then some goalies seem overrated while others seem underrated. Is that because the consensus thinking is wrong or is it because expected goals models are imperfect?
I will compare Rangers and Tampa Bay to show you what I’m talking about.
Goaltending: NYR versus T.B
I think everyone agree that Henrik Lundqvist has had an amazing career, but if you only look at GSAx he has been so much better and consistent than everyone else, it’s crazy.
Here’s a list of every goaltender with a LS-GAA above 50 in their career. The only one that’s even comparable to Lundqvist is John Gibson, because he has played way less games.
| Player | GP | GK |
|---|---|---|
| Henrik Lundqvist | 764 | 284.7 |
| Jaroslav Halak | 504 | 105.6 |
| John Gibson | 287 | 86.7 |
| Carey Price | 682 | 83.8 |
| Jonathan Quick | 644 | 67.8 |
| Roberto Luongo | 626 | 67.0 |
| Sergei Bobrovsky | 507 | 66.6 |
| Braden Holtby | 468 | 62.4 |
| Jonas Hiller | 404 | 61.9 |
| Corey Crawford | 486 | 60.3 |
| Cory Schneider | 409 | 58.1 |
| Frederik Andersen | 369 | 56.6 |
| Cam Ward | 611 | 55.1 |
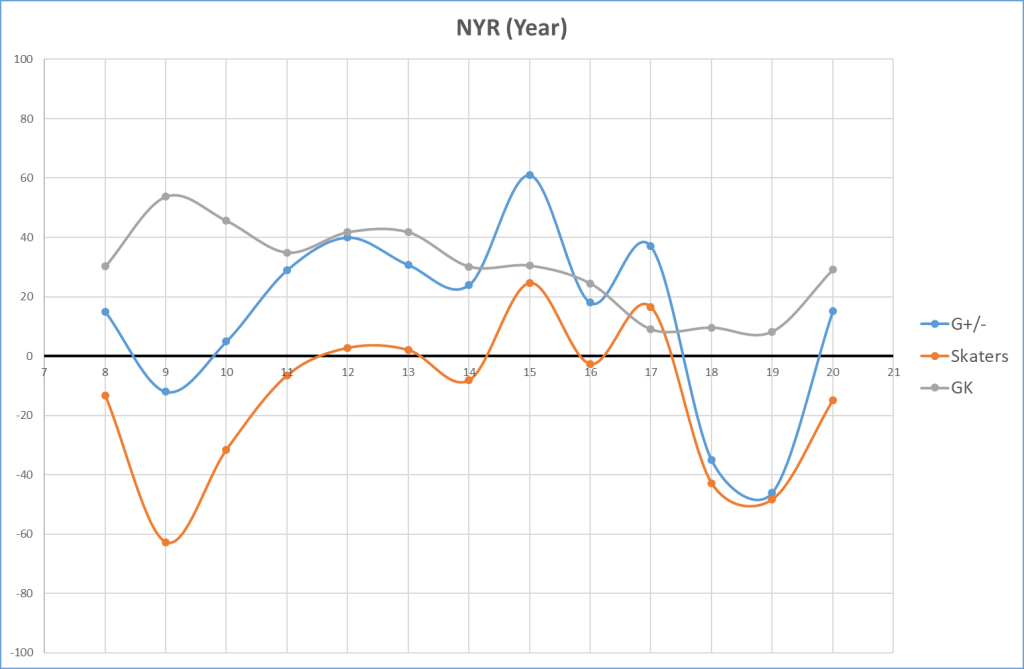
And what kind of impact will goaltending like that have on team performance overall? Here’s the performance graph of New York Rangers:
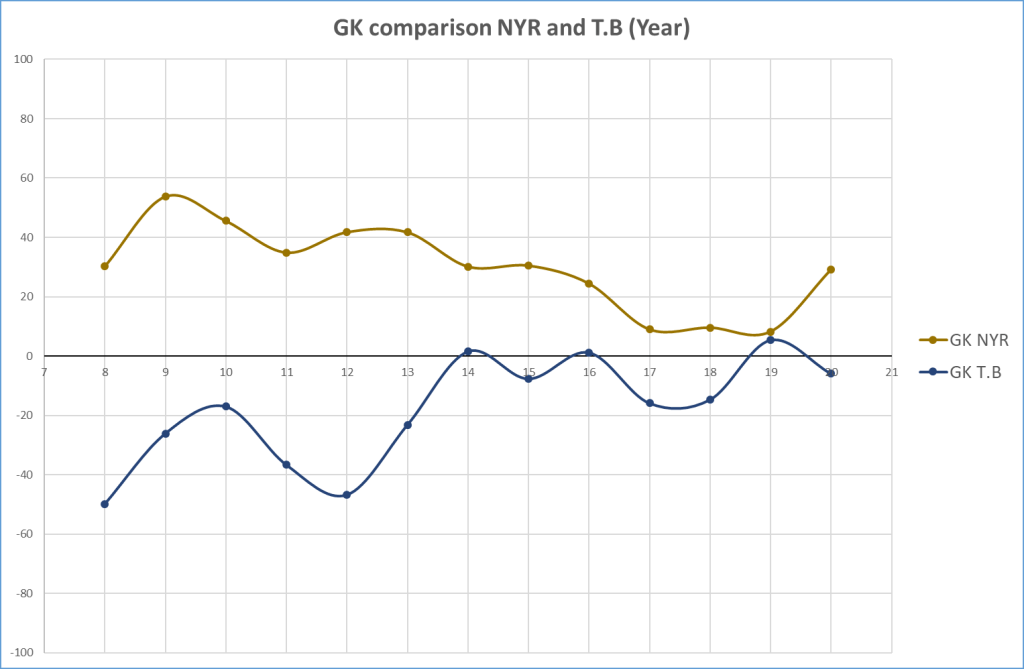
That brings us to Tampa Bay – the other example in this goaltending case. According to the model, Tampa Bay has never gotten good goaltending. Here’s the performance graph:

And if we compare the goaltending directly, we see that the only year it was close, was in the 2018/2019 season. Andrei Vasilevskiy won the Vezina that year.
If we compare the teams using save percentage, it’s a lot closer:

My point with this whole exercise was to show that goaltending is difficult to explain. It’s obviously somewhat connected to team defense, but I don’t really know how.
Is Lundqvist truly the greatest goaltender of this era and perhaps all time? I honestly don’t know, but I don’t trust GSAx enough to make that claim.
Goaltending is frustrating and fascinating at the same time. I used to be one myself, and I don’t understand it.
That’s it for this blog. Next time I will look at LS-GAA on the individual player level – the micro level. If there’s a specific team or case you want me to go into detail with, write it in the comment section.
Conclusion:
- I have made yearly adjustments to the model, to better adjust for changes over time.
- What’s up with goaltending? Hard to explain, even harder to predict. Some “stats people” believe goaltending is almost completely unaffected by team play. I don’t, but at the same time, I don’t know how they’re connected.
- Everything I have done up until this point, has been to describe past results. I have made a LS-GAA model and refined its descriptive ability, so that LS-GAA is as close to actual G+/- as possible. The end goal though, is to make a predictive model using LS-GAA on a player level as the basis.
Stay safe and remember to be kind
All raw data from evolving-hockey.com

I also find goaltending to be extremely difficult to gauge because if you are on a bad defensive team, you technically have ‘more chances’ to show your worth. perhaps a weighted average save percentage on LD, MD, and HD chances would be better to show how ‘good’ the goalie is versus certain types of shots. As a rangers fan who watched from teh beginning of Lundqvist’s career, I can easily say he had a terrible team in front of him, so i definitely believe he had a much better chance to stash up GSAX compared to other goalies because they gave up so many dangerous opportunities against him (not entirely sure what the xGA was for the rangers throughout his career, but watching the games it felt like a lot, and a lot were from odd man rushes which is not counted in xGA).The trouble for evaluating goalies is that it’s difficult to define what a good goalie is. Do you want longevity (playing 70+ games like brodeur)? do you want high stamina during the game (facing tons of high xG shots like lundqvist)? do you want high weighted average save % (perhaps Tim Thomas had this? not sure)? GSAX, GSAA/60, etc. I have 0 clue what stat could showcase it. Perhaps someone needs to combine a bunch of goalie metrics and make some ‘goalie score’
LikeLike
I also find goaltending to be extremely difficult to gauge because if you are on a bad defensive team, you technically have ‘more chances’ to show your worth. perhaps a weighted average save percentage on LD, MD, and HD chances would be better to show how ‘good’ the goalie is versus certain types of shots.
As a rangers fan who watched from teh beginning of Lundqvist’s career, I can easily say he had a terrible team in front of him, so i definitely believe he had a much better chance to stash up GSAX compared to other goalies because they gave up so many dangerous opportunities against him (not entirely sure what the xGA was for the rangers throughout his career, but watching the games it felt like a lot, and a lot were from odd man rushes which is not counted in xGA).
The trouble for evaluating goalies is that it’s difficult to define what a good goalie is. Do you want longevity (playing 70+ games like brodeur)? do you want high stamina during the game (facing tons of high xG shots like lundqvist)? do you want high weighted average save % (perhaps Tim Thomas had this? not sure)?
GSAX, GSAA/60, etc. I have 0 clue what stat could showcase it. Perhaps someone needs to combine a bunch of goalie metrics and make some ‘goalie score’
LikeLike