In the previous blogs I have showed, that LS-GAA can describe team performance really well. It correlates almost perfectly with goal differential. However, this doesn’t necessarily mean that the model works equally well on the player level. When you look at individual players in detail, you can find examples of players being overvalued or undervalued. This is where the eye-test and scouting comes into play. Just remember that the model works great on the team level, so if you think one player is undervalued, then there must be at least one other player on the same team that is overvalued.
I consider LS-GAA to be a great player model if it can do the following:
- For the most part agree with consensus thinking. If the model ranks players completely different than everyone else, then it’s probably not a good model. Unless of course everyone else is wrong.
- At the same time, you want the model to be able to find diamonds in the rough. Players that do all the little things right, but aren’t getting the recognition they deserve.
- Finally, the model should be predictive. Past results can hopefully tell you something about future results. I will look at this in the coming blogs.
Now, let’s look at some actual numbers. Here’s the top 20 players in terms of career numbers (from 2007 to 2020):
| Player | TOI_ALL | Total |
|---|---|---|
| Henrik Lundqvist | 44587 | 284.65 |
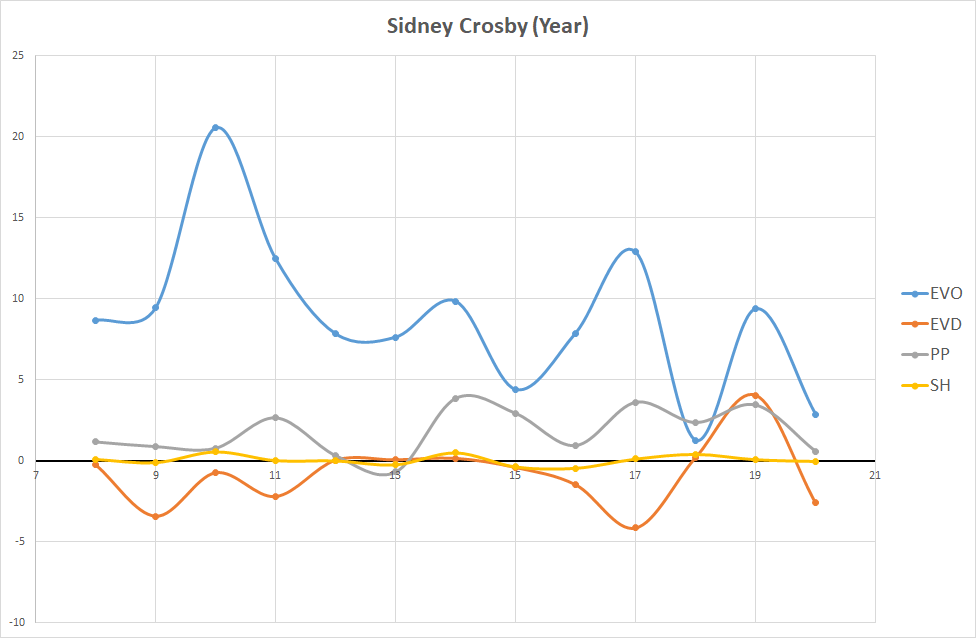
| Sidney Crosby | 17226 | 144.42 |
| Pavel Datsyuk | 11728 | 133.06 |
| Jaroslav Halak | 29050 | 105.57 |
| Steven Stamkos | 15559 | 104.49 |
| Anze Kopitar | 21093 | 100.28 |
| Alex Ovechkin | 20609 | 99.67 |
| Evgeni Malkin | 16613 | 96.92 |
| Brad Marchand | 13268 | 96.81 |
| Joe Thornton | 18052 | 96.48 |
| Jonathan Toews | 18736 | 95.90 |
| Joe Pavelski | 18605 | 88.07 |
| John Gibson | 16403 | 86.68 |
| Mark Giordano | 19468 | 84.83 |
| Patrice Bergeron | 16057 | 83.86 |
| Carey Price | 40214 | 83.76 |
| Shea Weber | 21854 | 82.08 |
| T.J. Oshie | 14906 | 76.72 |
| Zdeno Chara | 22817 | 76.45 |
| Jared Spurgeon | 14611 | 75.25 |
I talked about Henrik Lundqvist in blog 3, so I won’t discuss him here. I think it’s a pretty good list, but T.J. Oshie and Jared Spurgeon are surprise appearances in my mind.
I will focus on the forwards for the remainder of this blog. So here’s the top 20 forwards in terms of LS-GAA per 60 minutes. I have set the minimum TOI at 2500 minutes.
| Player | TOI_ALL | Total | per 60 |
|---|---|---|---|
| Pavel Datsyuk | 11728 | 133.06 | 0.681 |
| Elias Pettersson | 2554 | 24.59 | 0.578 |
| Connor McDavid | 7531 | 65.69 | 0.523 |
| Mark Stone | 8493 | 72.23 | 0.510 |
| Sidney Crosby | 17226 | 144.42 | 0.503 |
| David Pastrnak | 6740 | 55.76 | 0.496 |
| Brayden Point | 5516 | 44.14 | 0.480 |
| Anthony Cirelli | 2711 | 21.44 | 0.475 |
| Auston Matthews | 5299 | 41.10 | 0.465 |
| Nikita Kucherov | 9255 | 71.54 | 0.464 |
| Brad Marchand | 13268 | 96.81 | 0.438 |
| Vladimir Tarasenko | 8926 | 63.58 | 0.427 |
| Steven Stamkos | 15559 | 104.49 | 0.403 |
| Artemi Panarin | 7699 | 49.82 | 0.388 |
| Evgeni Malkin | 16613 | 96.92 | 0.350 |
| Yanni Gourde | 3899 | 22.74 | 0.350 |
| Oliver Bjorkstrand | 3559 | 20.49 | 0.345 |
| Jake Debrusk | 3148 | 18.05 | 0.344 |
| Nikolay Zherdev | 3688 | 20.90 | 0.340 |
| Alex Debrincat | 3891 | 21.69 | 0.334 |
Okay, so there’s a few to take notice of in this table. The model absolutely loves Datsyuk and Petterson. The list also includes players like Cirelli and Gourde, who probably doesn’t belong there, but Tampa Bay has been so dominant in the last couple of years, that their numbers are likely a bit to high. Bjorkstrand is one of those players, that flies under the radar. The model thinks he’s elite.
Next I would like to look at the defensive forwards, so I have listed the best forwards in terms of Even strength defense per 60 minutes of even strength play.
| Player | TOI_EV | EVO | EVD | EVD_60 |
|---|---|---|---|---|
| Tom Wandell | 2307 | -12.61 | 13.74 | 0.357 |
| Andrew Murray | 2034 | -4.56 | 9.60 | 0.283 |
| Pavel Datsyuk | 8963 | 40.75 | 39.79 | 0.266 |
| Justin Fontaine | 2142 | 5.56 | 9.34 | 0.262 |
| Dmitrij Jaskin | 3436 | -9.95 | 14.79 | 0.258 |
| Ryan Shannon | 2697 | -8.49 | 11.57 | 0.257 |
| Mathieu Darche | 2348 | -3.32 | 9.33 | 0.238 |
| Patrice Bergeron | 11567 | 33.69 | 45.31 | 0.235 |
| Mikko Koivu | 12695 | -11.32 | 49.67 | 0.235 |
| Marcus Kruger | 5572 | -12.34 | 21.20 | 0.228 |
| Joel Eriksson Ek | 2526 | -6.20 | 9.60 | 0.228 |
| Daymond Langkow | 4105 | 2.13 | 15.27 | 0.223 |
| Jordan Weal | 2523 | -3.02 | 9.20 | 0.219 |
| Riley Nash | 6186 | -16.11 | 22.05 | 0.214 |
| Cody McCormick | 2830 | -17.44 | 9.96 | 0.211 |
| Peter Regin | 2681 | -3.28 | 9.18 | 0.206 |
| Blake Coleman | 3117 | -3.07 | 10.59 | 0.204 |
| Nick Shore | 3136 | -14.78 | 10.50 | 0.201 |
| Boyd Gordon | 5997 | -28.48 | 19.24 | 0.193 |
| Marcus Foligno | 6887 | 0.53 | 22.08 | 0.192 |
The list includes Datsyuk, Bergeron and Mikko Koivu as expected, but also a lot of lesser known players with bad offensive numbers.
Finally, I will look at this season. Here are the top performers of the 2019/2020 season (so far):
| Player | TOI_ALL | EVO | EVD | PP | SH | PEN | Total |
|---|---|---|---|---|---|---|---|
| Brad Marchand | 1362 | 10.70 | 1.58 | 0.20 | 0.75 | 2.36 | 15.59 |
| Elias Pettersson | 1260 | 8.91 | 2.44 | 0.38 | 0.00 | 3.18 | 14.91 |
| Artemi Panarin | 1422 | 12.16 | 1.01 | 0.97 | 0.00 | 0.35 | 14.49 |
| Auston Matthews | 1468 | 9.46 | 1.45 | 1.66 | 0.00 | 1.19 | 13.76 |
| David Pastrnak | 1327 | 7.38 | -0.57 | 5.29 | 0.00 | 0.65 | 12.75 |
| Nathan MacKinnon | 1465 | 8.77 | 0.43 | 0.41 | 0.00 | 2.23 | 11.84 |
| Brayden Point | 1248 | 9.20 | 0.45 | 0.70 | 0.05 | 1.29 | 11.69 |
| Nikita Kucherov | 1283 | 10.63 | 1.27 | -0.52 | 0.00 | -0.19 | 11.18 |
| Oliver Bjorkstrand | 879 | 7.49 | 4.44 | -1.39 | 0.00 | 0.58 | 11.12 |
| Jack Eichel | 1502 | 5.96 | 0.61 | 0.24 | -0.07 | 3.77 | 10.51 |
| Valeri Nichushkin | 914 | 3.58 | 5.82 | -1.40 | 0.48 | 1.17 | 9.65 |
| Dominik Kubalik | 978 | 10.78 | -0.23 | -0.74 | 0.00 | -0.32 | 9.49 |
| Travis Konecny | 1109 | 6.59 | -0.01 | 1.39 | 0.00 | 1.34 | 9.31 |
| Anthony Cirelli | 1255 | 3.14 | 3.54 | 0.22 | -0.44 | 2.66 | 9.13 |
| Jake Guentzel | 805 | 5.79 | 1.09 | 0.59 | 0.12 | 1.47 | 9.06 |
| Max Pacioretty | 1271 | 6.55 | 2.14 | 0.93 | 0.00 | -0.71 | 8.92 |
| Patrice Bergeron | 1142 | 3.56 | 2.47 | 3.49 | 0.49 | -1.08 | 8.92 |
| Mark Stone | 1261 | 6.11 | 1.04 | 1.76 | -0.12 | -0.01 | 8.78 |
| Mika Zibanejad | 1233 | 7.04 | -2.43 | 3.32 | -1.59 | 1.72 | 8.06 |
| Leon Draisaitl | 1605 | 8.38 | -4.60 | 3.96 | -1.44 | 1.48 | 7.79 |
This list definitely consists of a few players that are either overrated by the model or not getting the recognition they deserve. Leon Draisaitl who will likely win the Hart, is just ranked 20th and McDavid is ranked even lower. This is primarily due to bad defense, but it seems to low if you ask me.
And here’s the numbers if we look at the per 60 data:
| Player | TOI_ALL | Total | per 60 |
|---|---|---|---|
| Oliver Bjorkstrand | 879 | 11.12 | 0.759 |
| Elias Pettersson | 1260 | 14.91 | 0.710 |
| Brad Marchand | 1362 | 15.59 | 0.687 |
| Jake Guentzel | 805 | 9.06 | 0.676 |
| Valeri Nichushkin | 914 | 9.65 | 0.633 |
| Artemi Panarin | 1422 | 14.49 | 0.611 |
| Dominik Kubalik | 978 | 9.49 | 0.582 |
| David Pastrnak | 1327 | 12.75 | 0.576 |
| Auston Matthews | 1468 | 13.76 | 0.563 |
| Brayden Point | 1248 | 11.69 | 0.562 |
| Nikita Kucherov | 1283 | 11.18 | 0.523 |
| Travis Konecny | 1109 | 9.31 | 0.504 |
| Jesper Bratt | 839 | 6.86 | 0.491 |
| Nathan MacKinnon | 1465 | 11.84 | 0.485 |
| Craig Smith | 926 | 7.44 | 0.482 |
| Andrew Mangiapane | 932 | 7.45 | 0.480 |
| Patrice Bergeron | 1142 | 8.92 | 0.468 |
| Anthony Cirelli | 1255 | 9.13 | 0.436 |
| Max Pacioretty | 1271 | 8.92 | 0.421 |
| Jack Eichel | 1502 | 10.51 | 0.420 |
The list is a combination of the big guns and some lesser known players. The question is if players like Bjorkstrand, Konecny and Mangiapane are overperforming this season or if they can sustain this level of play in a bigger role for their teams.
That’s it for this blog. You can find all the data in an excel document if you press Data in the top right corner. Next blog I will look at the defenders.
Conclusion:
- LS-GAA is a tool you can use to evaluate players, but you still need to use your common sense. No statistical metric can ever tell the whole truth on the player level. I think LS-GAA is the best evaluation tool I have come across, but I still need to be skeptical sometimes.
- LS-GAA explains team results almost to perfection. So if one player is undervalued, then at least one other player on the same team has to be overvalued.
Stay safe and remember to be kind
All raw data from evolving-hockey.com
