
For the past few seasons, I’ve been manually tracking Game Projections from different models. Now, I want to wholly automate the tracking process. Let me know if you have a projection that you want included in the tracking process. You can contact me on Twitter and via email: lars.sunesen.skytte@gmail.com To be part of the trackingContinue reading “Do you have a game projection model?”
Category Archives: Statistics
Model Tracking 2023/2024

Over the last couple of seasons, I’ve been tracking Game Projections from a number of different models. I want to continue the tracking, but instead of manually tracking the models I want to automate the process. This will make my life so much easier for me. Let me know if you want me to includeContinue reading “Model Tracking 2023/2024”
Model Projections – 2023/2024

Season Projections from HockeyViz, DRatings, DoNotTail, Evolving-Hockey, Dom (The Athletic), MoneyPuck, Hockey-Statistics and the over/under point total from Bet365. The Atlantic Division: The Metropolitan Division: The Central Division: The Pacific Division:
NHL Guide: 2023/2024

The following article is part of the NHL Guide 2023/2024. If you want access to the full guide (including Visualizations) or you just want to support my continued work, you should subscribe for just 10$ annually. Model Description 3-year weighted data: The season projections are based on performances from the previous 3 seasons. Last seasonContinue reading “NHL Guide: 2023/2024”
WHKYHAC – Power BI Workshop

Installing Power BI: Go to powerbi.microsoft.com and click on Products -> Power BI Desktop: From here you should be able to download a free version: Once you have the program installed you should be ready to build visuals. However, if you want to publish the visuals you will need to create an account and loginContinue reading “WHKYHAC – Power BI Workshop”
Explainer – Player Cards

In this piece I want to talk about the newly created Player Cards. The player cards are meant to describe the performance in the 22/23 NHL season. These cards should be seen as temporary cards until the new models are ready. In the coming weeks (or months) I will rebuild the models that all myContinue reading “Explainer – Player Cards”
WHKYHAC – Visualization project
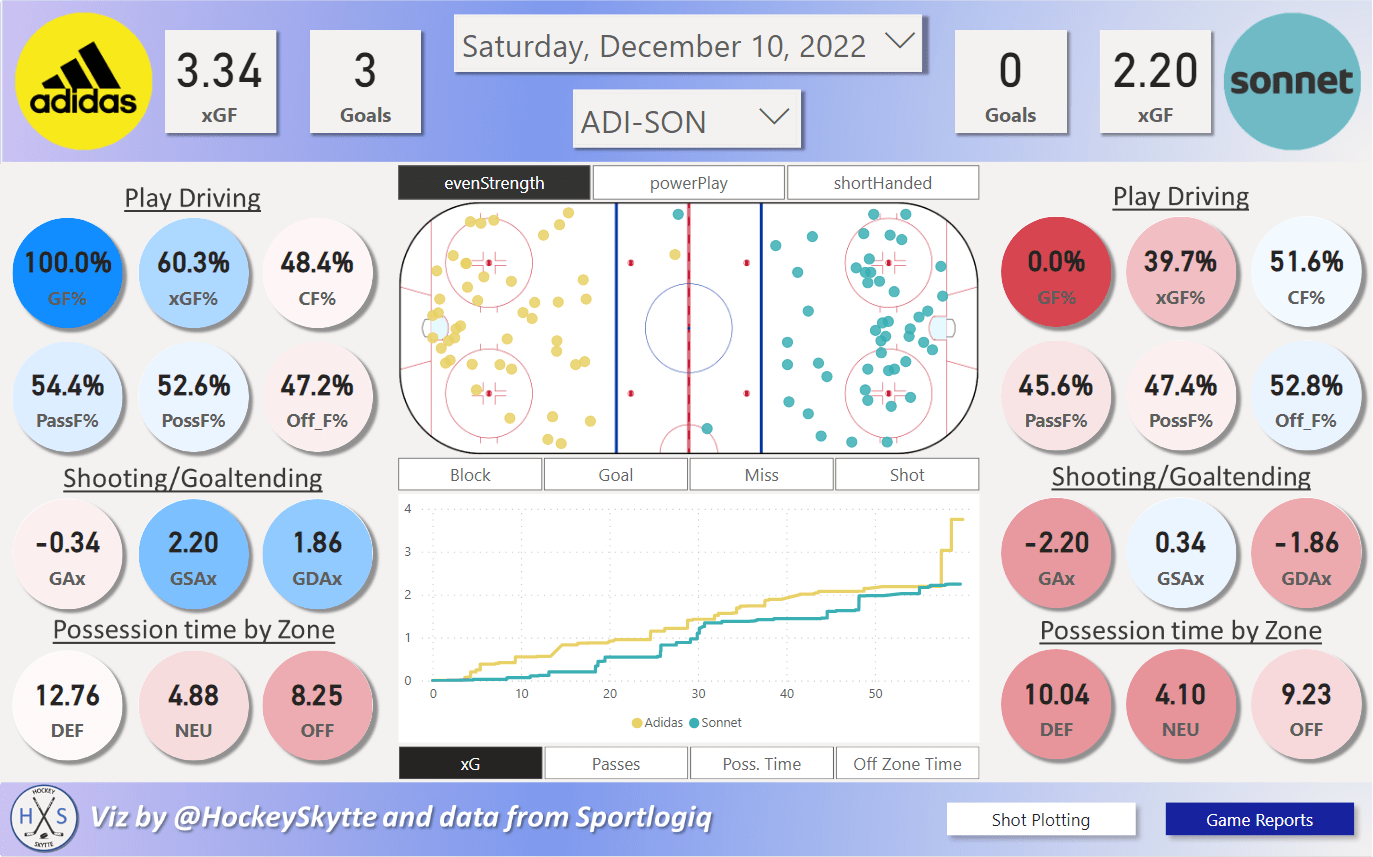
On July 15th there’s a Women’s Hockey Analytics Conference (WHKYHAC). Because of this I’m building a Visualization Project where I’m using Sportlogiq’s PWHPA data. The Visualizations can be found here: WHKYHAC Visualizations (Dark Version). In this article I will do a short write-up on the visualizations as I build them. I will try to answerContinue reading “WHKYHAC – Visualization project”
Perspective: Perception – Decision – Execution
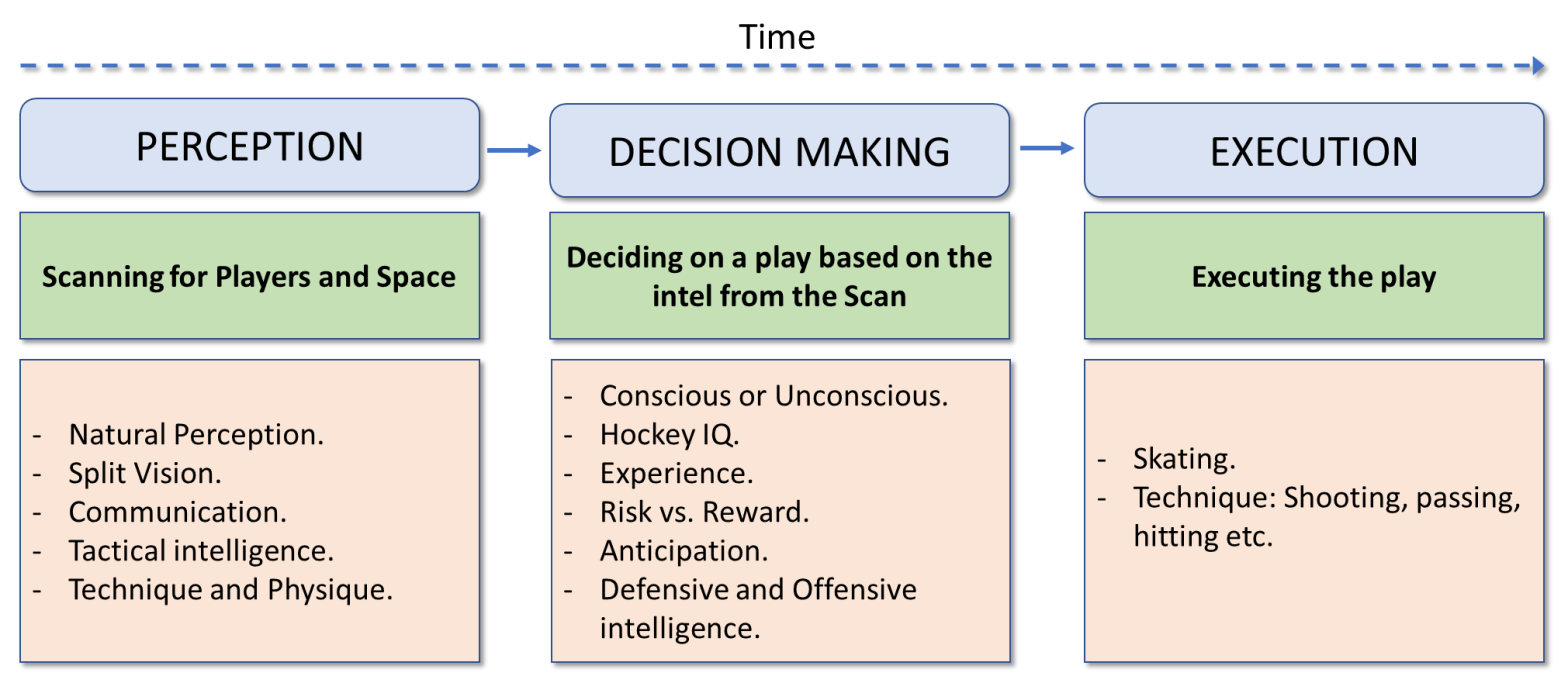
In this third perspective article, I want to dig into a somewhat unconventional way to do player analysis. I think this is a very interesting discussion to have, and hopefully you’re able to follow my thought process. The 4 Pillars Often you define and evaluate players through the 4 pillars: Technical, Tactical, Physical and Psychological/Mental.Continue reading “Perspective: Perception – Decision – Execution”
Video tutorial: Working with Shot data

Video 1: Combining Shot Statistics data from multiple seasons into one pivot table in Excel Video 2: Creating a Shot visualization in Power BI Files: Shot Statistics Data (Onedrive link with updated data), Rink Image and Power BI project. Online link to the Project In order to publish Power BI projects you will need aContinue reading “Video tutorial: Working with Shot data”
Video Tutorial: Creating a Shot Visualization Tool

The primary goal with this video tutorial is to show that shot tracking and shot plotting doesn’t have to be that complicated. The visualization is created in Excel, because it’s what I know, but also because Excel is less intimidating to most people. The end goal is to get more people interested in hockey statistics!Continue reading “Video Tutorial: Creating a Shot Visualization Tool”
