
This is where things start to get interesting. Up until this point I have only talked about LS-GAA as a descriptive tool – a way to evaluate players and teams. Now I will use LS-GAA as the basis for a predictive model. To do this, I will introduce projected LS-GAA (pLS-GAA), which is the expected performance based on past results.
In this blog I’m simply weighing LS-GAA from the previous 3 seasons. I’m using a 3-2-1 weighing, which is pretty steep, but I will compare with flatter weighings later on. Here’s the projected LS-GAA for next season if we do this:
pLS-GAA(20/21) = 1/2 * LS-GAA(19/20) + 1/3 * LS-GAA(18/19) + 1/6 * LS-GAA(17/18)
I actually like the simplicity of this model. Sometimes less is more. If a player is a rookie, his pLS-GAA will just be 0, so every player is considered average until there’s some NHL data. This way I likely overvalue most rookies. Because I’m using total numbers instead of per 60 rates, the model is fairly slow to react.
We can use Kaapo Kakko as an example as he has been the worst skater this season according to LS-GAA. Here’s his projected LS-GAA:
pLS-GAA(Kakko-20/21) = 1/2 * -10.8 + 0 + 0 = -5.4
So because he’s a rookie the model expects some regression towards average. Most other models use per 60 data, and then estimates the TOI based on expected role. This is how Dom Luszczyszyn does it in his model. My projection model assumes players keep the same role on the team and therefore keep the same ice time more or less.
Projecting the 2019/2020 season
With that short introduction I will now try and project the 2019/2020. I have set up two restrictions in this analysis:
- I’m only looking at the players who actually played in the 2019/2020 season – TOI(19/20)>0
- I have set the minimum projected time on ice to 200 minutes. This means that the minimum requirements are either TOI(18/19)>400, TOI(17/18)>800, TOI(16/17)>1200 or some combination of the requirements.
When I later on try to project future team performances I will include all players, but for this analysis I think the restrictions make sense.
So let’s look at the correlation between projected TOI and actual TOI:
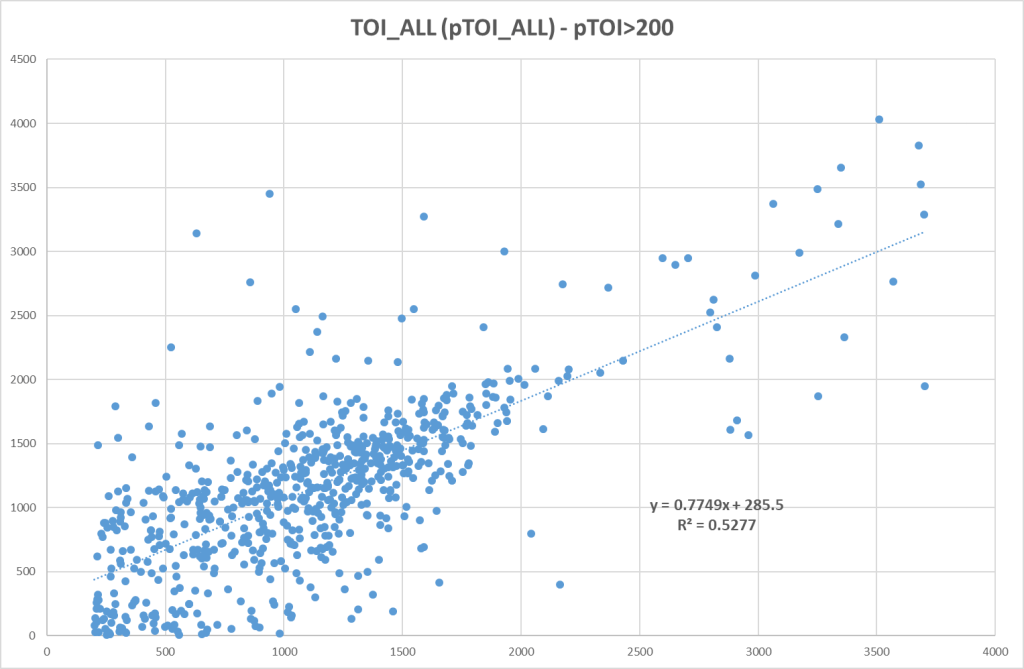
There’s a lot of players with a high pTOI, but low actual TOI. This could be injured players like Tarasenko or it could be players with NHL experience who didn’t make the team out of camp (someone like Pontus Aberg). Other than that, I’m actually surprised by the correlation. It’s better than I expected.
And here’s the correlation if we don’t include goalies:
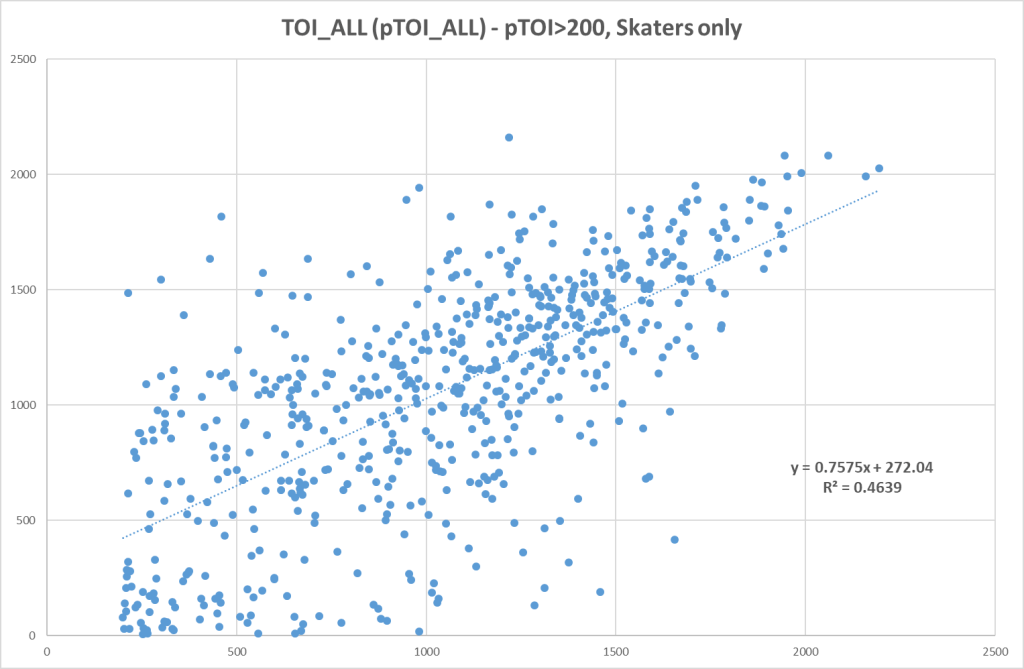
Using a weighted data from the previous 3 seasons is a decent way to project time on ice. The role a player has on a team is fairly consistent, but obviously this is not a perfect estimation.
Next up I will look at LS-GAA_total. How well does the projected value correlate with the actual value? Here’s the result:
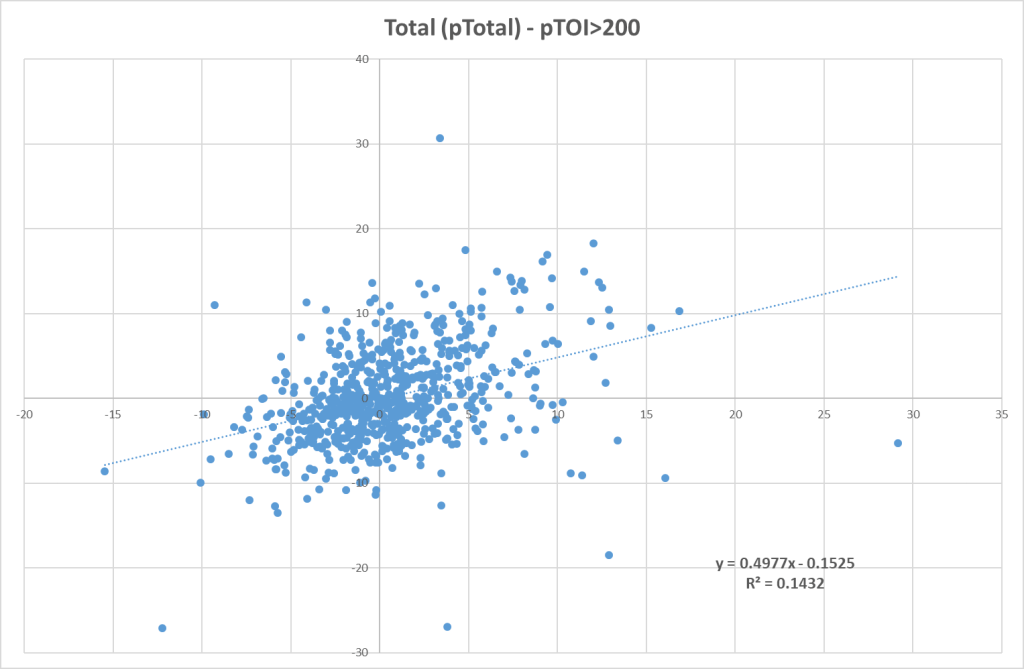
Not exactly a perfect scatter, but there’s definitely some correlation. This indicates that LS-GAA is somewhat repeatable, but it’s still difficult to predict.
Let’s look at the results based on position instead. The following graph shows how pLS-GAA correlates with actual LS-GAA amongst defenders.
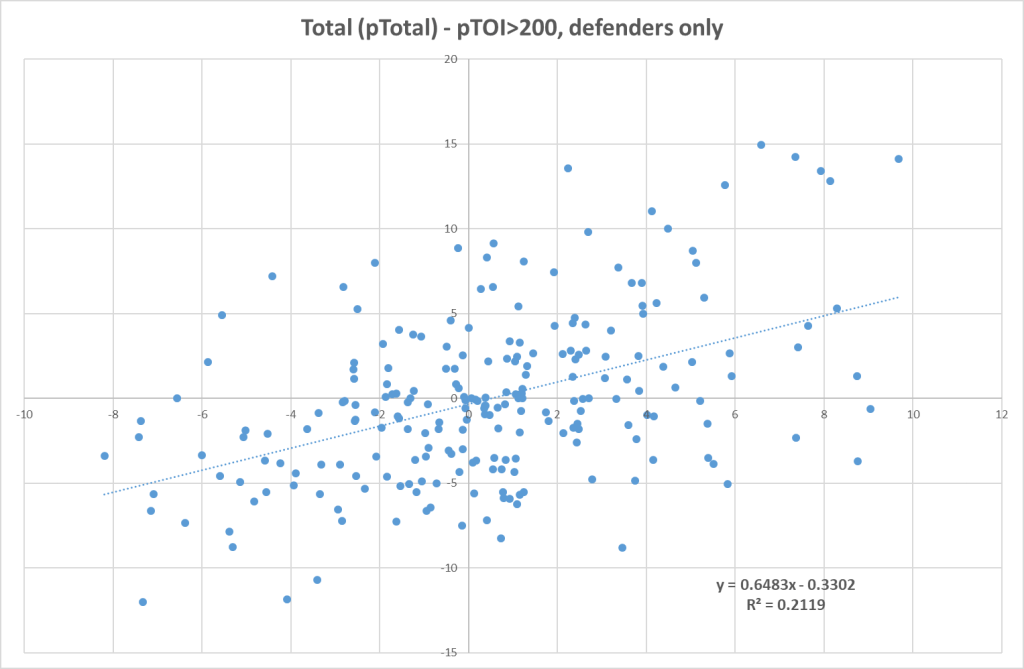
Now the correlation is much better, but still not perfect. We can do the same for the forwards as well:
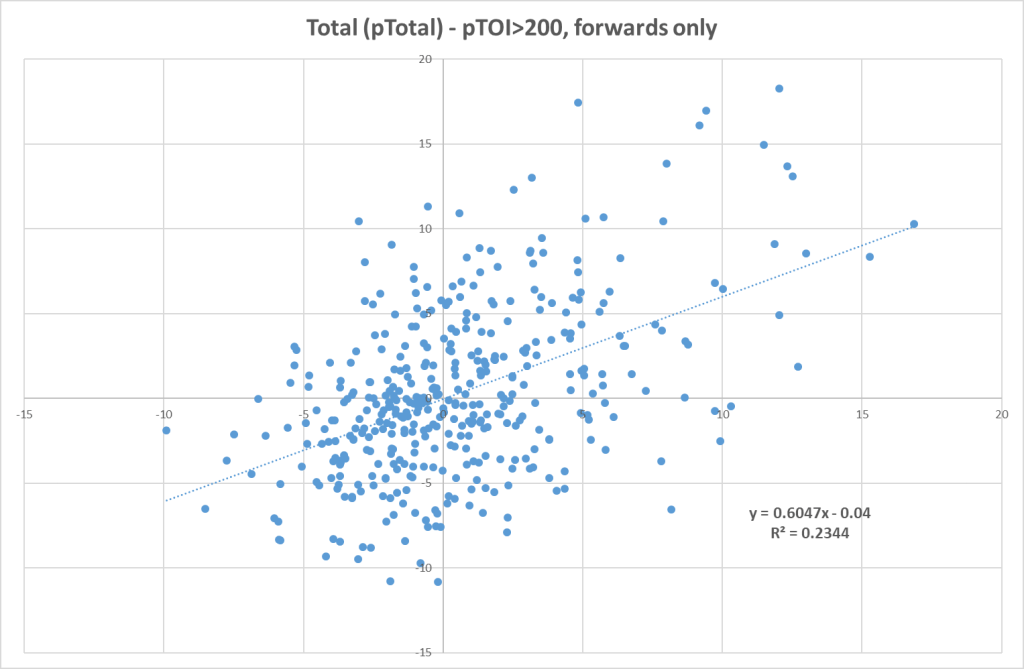
Here we see a similar but slightly better result indicating that LS-GAA overall can be projected pretty good for skaters.
Here’s the graph for the goalies:

And here’s the problem. LS-GAA amongst goalies is unpredictable. There’s almost no correlation between projected LS-GAA and actual LS-GAA. This is a huge problem when it comes to the predictability of my model. For now I will just acknowledge the problem, but later on I will try and refine the model so it better can predict future goaltender performances.
Next blog:
It’s difficult to interpret the above graphs if you don’t have great statistical knowledge, so in the next blog I will do the same exercise for other metrics. This way I can compare the predictability of LS-GAA with the predictability of Cosi, xG etc.
Conclusion:
- Goaltending (based on GSAx) is unpredictable. Adjustments to the model is needed, but this is not really a surprising finding. Every statitiscian knows the unpredictable nature of goaltending.
- For skaters this simple and early draft of the model actually works surprisingly well. That part bodes well for the future.
Stay safe and remember to be kind
All raw data from www.evolving-hockey.com

One thought on “Blog 10: Player projections – The repeatability of LS-GAA”