
For the last week or so, I’ve been working hard on my NHL Line Tool. It’s not the first version of the Line Tool, but I’ve added a lot of new features and it’s the first time the line tool goes all the way back to the 2010/2011 season. You can access the line toolContinue reading “NHL Line Tool”
Tag Archives: Power BI
Hockey Analytics – Testing the xG Models
Currently, I’m working on re-building my database and models. In this series I will take you through the process. The aim is to be as transparent and precise as possible. I will share all my code and all my files for everyone to use. Hopefully, this can be helpful in getting more people into hockeyContinue reading “Hockey Analytics – Testing the xG Models”
Video Tutorial – Full Hockey Analytics Project
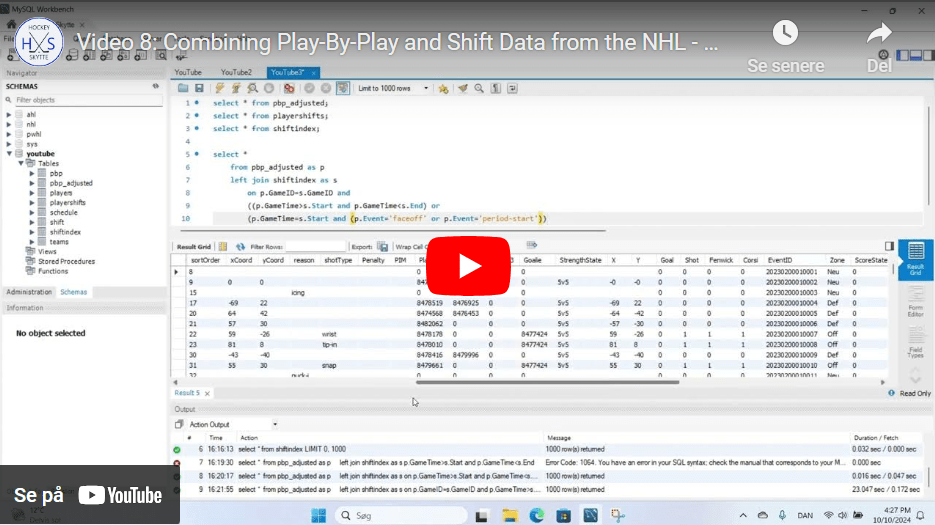
Every Wednesday I will upload a new video to YouTube. I will add the videos in this article as we go along. Schedule 2024-08-21: Getting data from the NHL Api based on date selection 2024-08-28: Scrape Shift data from the NHL HTML reports 2024-09-04: Get Play-by-Play and shift data for a full season at aContinue reading “Video Tutorial – Full Hockey Analytics Project”
New Visualization – Player Profiles

In the coming days and weeks, I hope to add new features/visualizations to the Statistics Tab. The new profile visualization can be found by clicking on Player Statistics 23/24. If you enjoy my work and wish support my continued work you can either donate a small amount below or Subscribe to my website (10$ annually).Continue reading “New Visualization – Player Profiles”
WHKYHAC – Power BI Workshop

Installing Power BI: Go to powerbi.microsoft.com and click on Products -> Power BI Desktop: From here you should be able to download a free version: Once you have the program installed you should be ready to build visuals. However, if you want to publish the visuals you will need to create an account and loginContinue reading “WHKYHAC – Power BI Workshop”
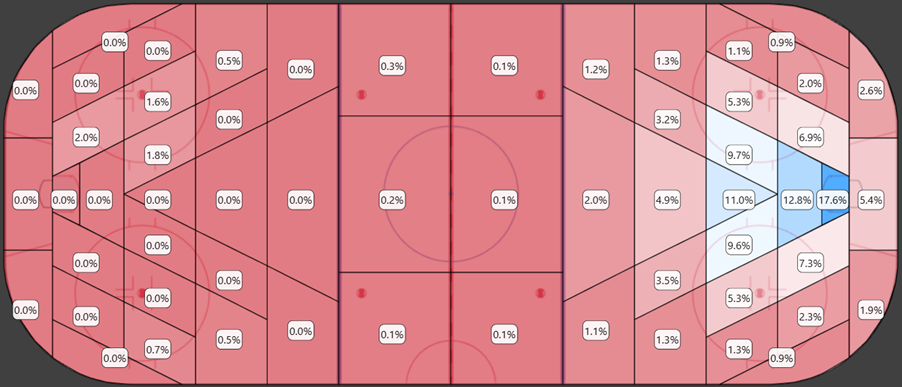
Video tutorial: Working with Shot data

Video 1: Combining Shot Statistics data from multiple seasons into one pivot table in Excel Video 2: Creating a Shot visualization in Power BI Files: Shot Statistics Data (Onedrive link with updated data), Rink Image and Power BI project. Online link to the Project In order to publish Power BI projects you will need aContinue reading “Video tutorial: Working with Shot data”
