
For the last week or so, I’ve been working hard on my NHL Line Tool. It’s not the first version of the Line Tool, but I’ve added a lot of new features and it’s the first time the line tool goes all the way back to the 2010/2011 season. You can access the line toolContinue reading “NHL Line Tool”
Category Archives: Statistics
Hockey Analytics – Testing the xG Models
Currently, I’m working on re-building my database and models. In this series I will take you through the process. The aim is to be as transparent and precise as possible. I will share all my code and all my files for everyone to use. Hopefully, this can be helpful in getting more people into hockeyContinue reading “Hockey Analytics – Testing the xG Models”
Hockey Analytics – Cleaning and Transforming NHL data in MySQL

Currently, I’m working on re-building my database and models. In this series I will take you through the process. The aim is to be as transparent and precise as possible. I will share all my code and all my files for everyone to use. Hopefully, this can be helpful in getting more people into hockeyContinue reading “Hockey Analytics – Cleaning and Transforming NHL data in MySQL”
Hockey Analytics – Getting data directly from the NHL Api

Currently, I’m working on re-building my database and models. In this series I will take you through the process. The aim is to be as transparent and precise as possible. I will share all my code and all my files for everyone to use. Hopefully, this can be helpful in getting more people into hockeyContinue reading “Hockey Analytics – Getting data directly from the NHL Api”
Hockey Analytics Competition?
Lately, I’ve been thinking about creating a public hockey analytics competition – So, this is just me thinking out loud. I really think it’s a shame that there currently isn’t a public analytics competition or a public analytics forum (like Hockey-Graphs used to be). I know that the Big Data Cup exists, but unfortunately noneContinue reading “Hockey Analytics Competition?”
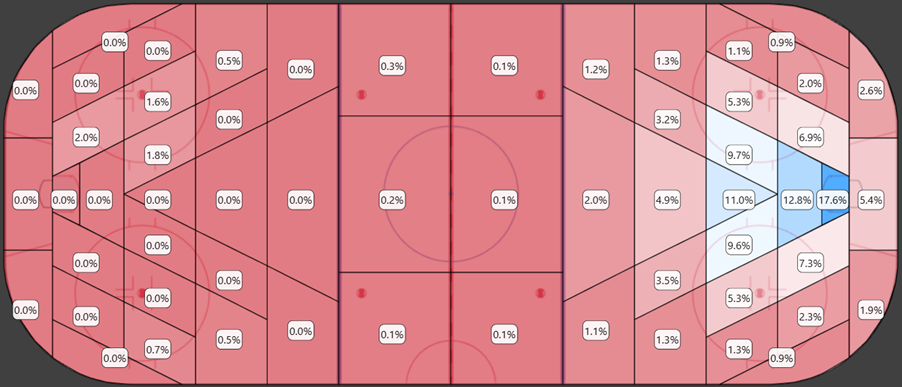
Big Data Cup: Player Positioning in relation to Puck Position
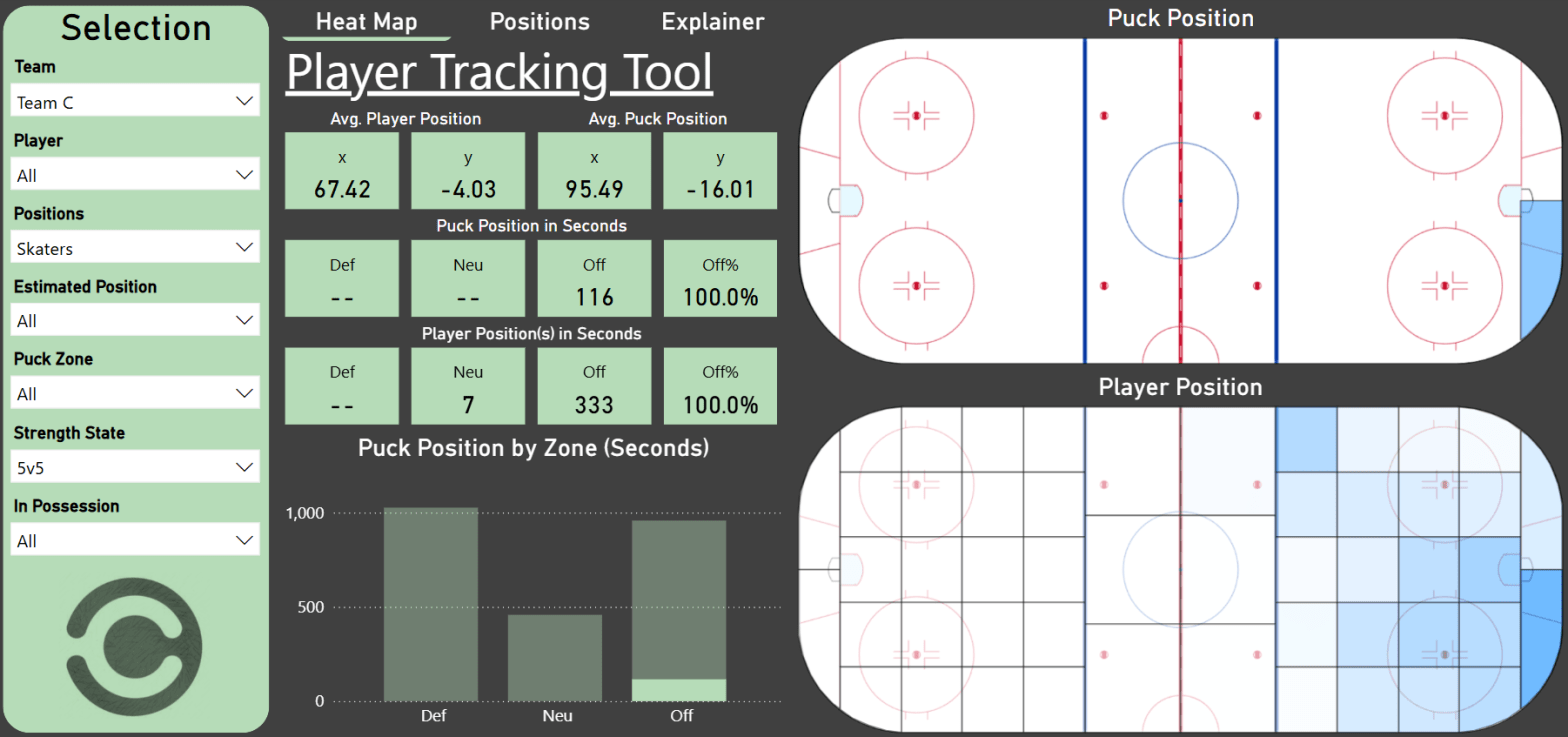
This project focuses on analyzing player positions in relation to puck positions on the ice using a custom tool that visualizes data as heat maps or average player locations. Coaches and players can utilize insights to enhance tactical understanding, improve defensive structures, and evaluate player roles.
Video Tutorial – Full Hockey Analytics Project
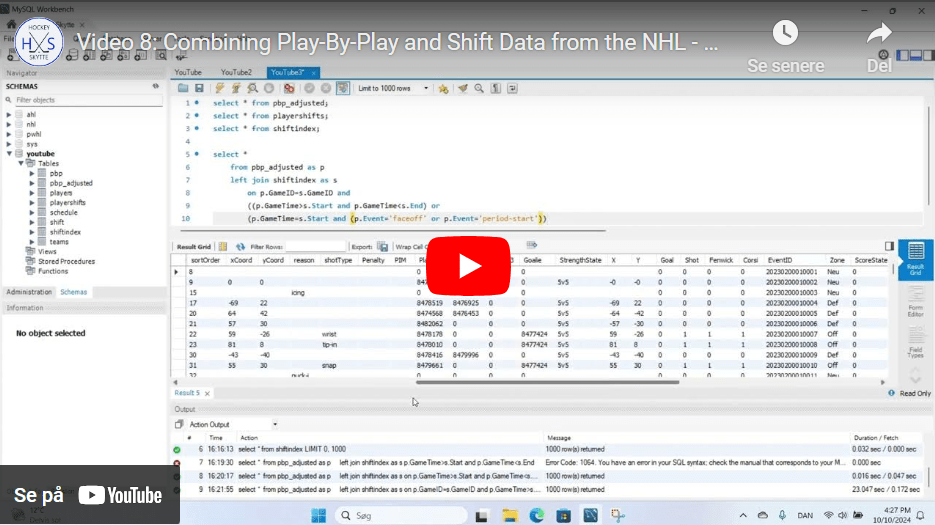
Every Wednesday I will upload a new video to YouTube. I will add the videos in this article as we go along. Schedule 2024-08-21: Getting data from the NHL Api based on date selection 2024-08-28: Scrape Shift data from the NHL HTML reports 2024-09-04: Get Play-by-Play and shift data for a full season at aContinue reading “Video Tutorial – Full Hockey Analytics Project”
LINHAC: Visualizing Sportlogiq’s Play-By-Play Data
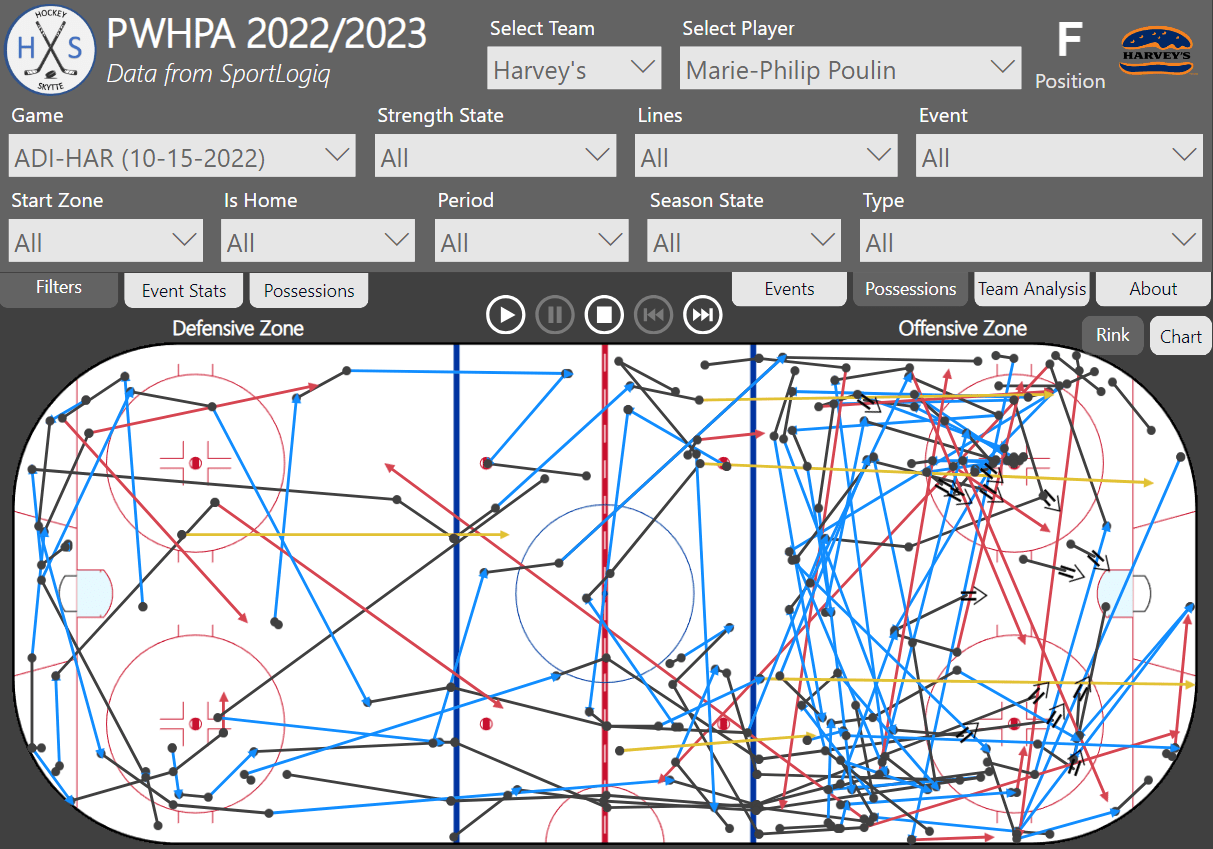
This project is created for the 2024 Linköping Hockey Analytics (LINHAC) presentation, aiming to visualize and interpret Sportlogiq’s play-by-play data. The approach prioritizes creating customizable visuals to enable end users to seek their own insights. The project delves into coaching theories, player evaluation, and strategic analysis, emphasizing the tool’s versatility for both coaching and analytics teams to uncover insights.
NHL Scraper

I’ve created an NHL scraper that can be used to get GameData directly from the new NHL Api. How the scraper is built is somewhat complicated, but I basically tried to aim for four things. Goals: How to use the Scraper: The following video illustrates how the Scraper can be used. The sound is aContinue reading “NHL Scraper”
New Visualization – Player Profiles

In the coming days and weeks, I hope to add new features/visualizations to the Statistics Tab. The new profile visualization can be found by clicking on Player Statistics 23/24. If you enjoy my work and wish support my continued work you can either donate a small amount below or Subscribe to my website (10$ annually).Continue reading “New Visualization – Player Profiles”
