In this article I’ll be looking at performance and trends of some historic betting data. All data in this article is from BetUS and it’s collected via SportsbooksReviewsOnline.
The Data
As mentioned, the data comes from BetUS, and the data goes from the start of 2007/2008 season and all the way up to November 27th, 2022. This means that the sample size from the 2022/2023 season is limited.
In this article I’ll only be using the Moneylines, but the data also includes Pucklines and Over/Under lines.
The data from SportsbooksReviewsOnline isn’t flawless, so I’ve cleaned the data a bit. There are some obvious mistakes (e.g. -1100 instead of -110), but there are also less obvious mistakes where I had to delete the betting data all together. This only happened a few times and mostly for the Opening lines.
As a final test I did a Kelly calculation. Since all the betting data is from the same bookmaker there should never be an edge… Meaning there should never be a positive Kelly value.
Here’s a link to the cleaned betting data
Analysis
So, let’s take a deeper look at the Moneyline data. The first thing I did was to calculate the implied win probability based on the Moneylines. The implied probability is hereon forward referred to as Expected Win Probability (xWin%).

This is important because we’re going to compare the Expected Win probability (xWin%) to the actual Win percentage (Win%).
Log loss is used to evaluate model/market performance. The lower the log loss the better the performance.

So, if a 60% favorite team losses the game (Win=0), then the log loss is:

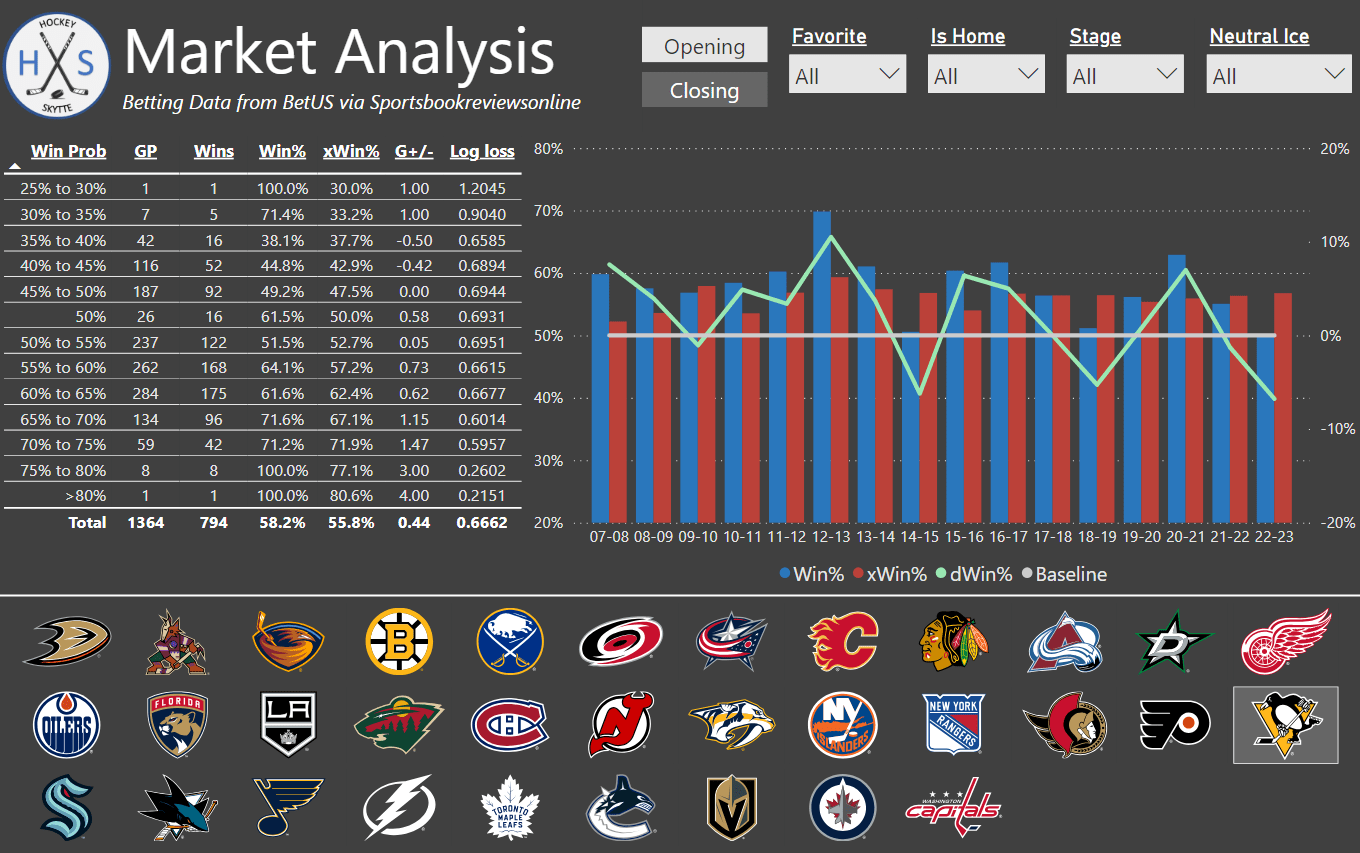
I’ve created a tool that can be used to analyze the betting data. You can find the visualization here.
Calibration Table
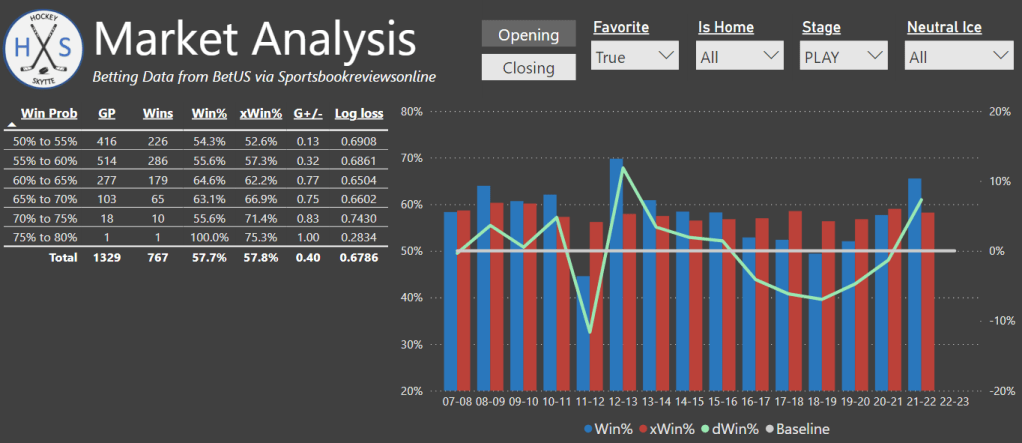
We will start off by looking at the calibration tables. The first table shows the results based on Opening Moneylines. Games where xWin% = 50% (same betting line on both teams) aren’t included in this table.

Generally, we see very little difference between expected win probability and the actual win percentage in all the bins except the “>80%” bin (but it’s only 4 games).
The average goal differential increases nicely with the xWin%, and the log loss decreases with increased xWin%. This is exactly what we would expect, and it shows that the opening market is well calibrated.
There is a slight mismatch between the average win percentage (58.6%) and expected win probability (58.2%). This means that the favorite wins more often than the market expects.
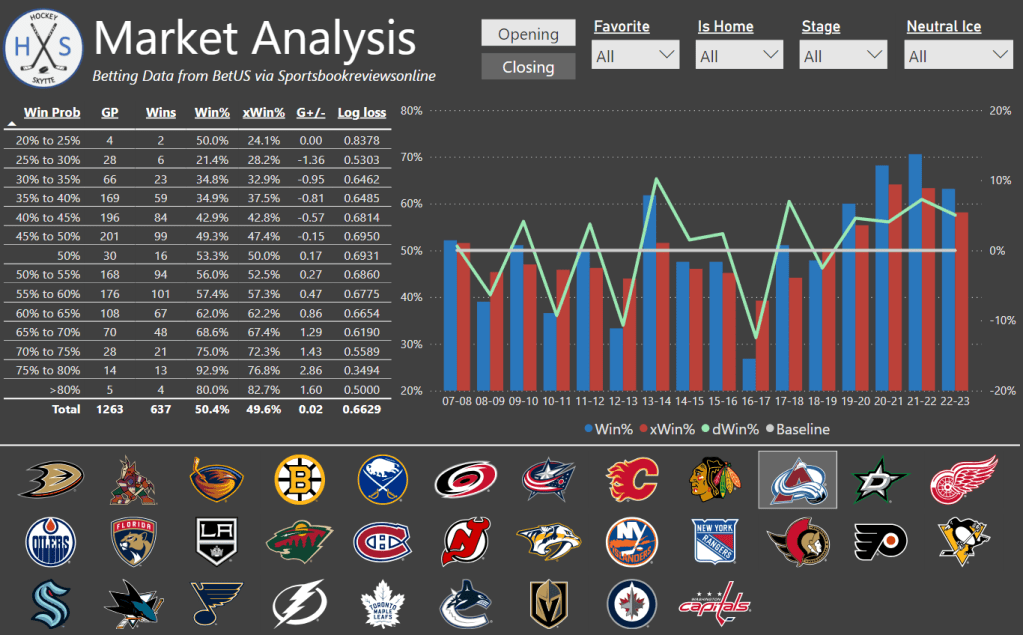
Below is the calibration table of the closing Moneylines:
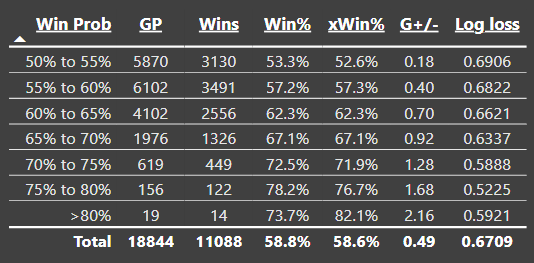
Clearly, the closing lines are very well calibrated. The gap between Win% (58.8%) and xWin% (58.6%) is much smaller on the closing lines. So, the lines generally move towards the favorite.
It’s also worth noting that the log loss is lower for the closing lines… So, the market is performing better. This is what we would expect with knowledge of the lineup and starting goaltender.
To conclude: There does appear to be a slight mismatch between the opening line xWin% and Win%, and that mismatch decreases as we get closer to game start.
So, if you see an edge on a favorite, then it’s probably worth betting early. If you see an edge on an underdog, then it’s less important to bet early… And it may even be better to wait until game start.
Season Trends
The blue columns show how often the favorite won the game and the red columns show how often the favorite was expected to win. The green line is the difference between actual wins and expectation:

If the green line is above the baseline, then the favorite is winning more than expected.

We see that the 20-21 and especially the 21-22 are outlier seasons, where the favorite team won much more often than in the other seasons. This is an indicator that the parity was lower in these seasons – The good teams were better and/or the bad teams were worse.
If we zoom in on the 21-22, we see that the favorite team won a whopping 65% of the games and the log loss was as low as 0.6421. This is indeed outlier results.

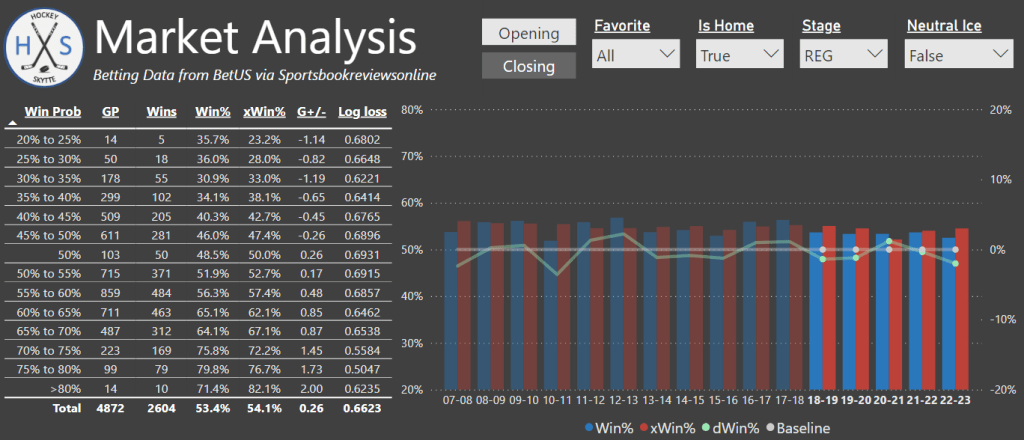
Home ice advantage
Next up, let’s look at the home ice advantage over the years. I’ve removed all neutral ice games and all playoff games (the higher seeded team has more home games leading to skewed data).
There’s no difference between the home ice advantage on opening odds and closing odds, so I will just look closing lines.
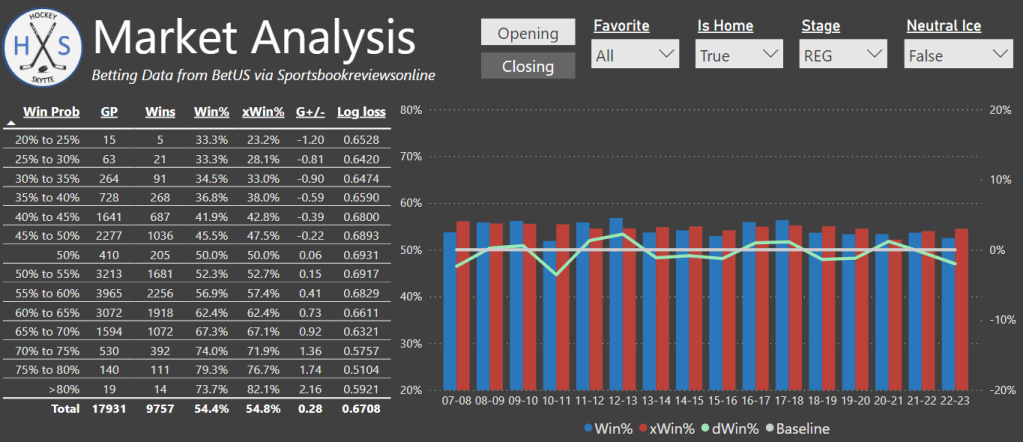
Generally, the market values home ice a little bit too much (54.8%) compared to the actual results (54.4%). The home team results are relatively stable, but there appears to be a slight downward trend (the home team winning less games). If we zoom in on the latest 5 seasons in the dataset, then the home team only wins 53.4% of games, and the market hasn’t adjusted enough.
The lowest home team win percentage came in 2010-2011 where the home team won less than 52% of the games.

Regular season vs. Playoffs
We can also compare the regular season to the playoffs.


Unsurprisingly, we see much more variance in the playoffs (smaller sample size) and a higher log loss which is indicative of more parity (it’s more difficult to predict results in the playoffs).
Another fun fact is that the opening lines in the playoffs are performing better than the closing lines. It’s probably just variance… But the lineups and starting goaltenders are easier to predict in the playoffs, so the information advantage at game start is smaller.
Team Analysis
Lastly, we can look at some specific teams.
Colorado Avalanche:
Before Colorado became the dominant team they are today, they were a roller coaster team unlike any other. It was just a decade of being awful only to be good the very next year. This means that they defied expectation pretty every year – either negatively or positively.
Vegas Golden Knights:
Another fun team to look at is the Golden Knights. They entered the league hot and absolutely outperformed expectation.

The consistently good and consistently bad teams:
An interesting trend is that the teams that have been consistently good for many, many years are generally undervalued by the market. The opposite is true for teams that have been consistently bad for many years.
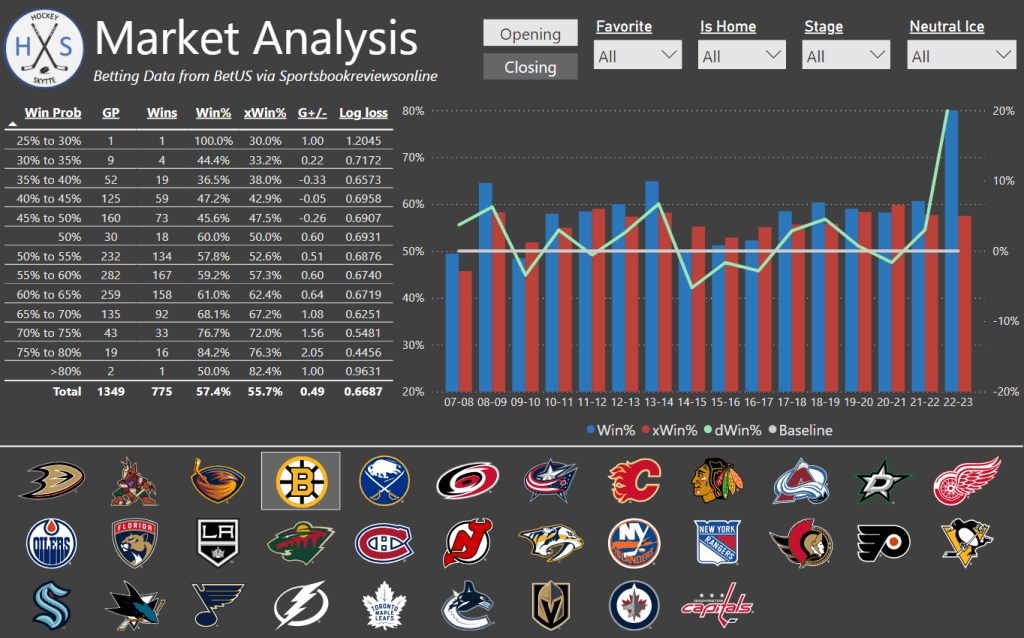
Washington Capitals (Win% = 57.0% vs. xWin% = 54.0%)

Pittsburgh Penguins (Win% = 58.2% vs. xWin% = 55.8%)

Boston Bruins (Win% = 57.4% vs. xWin% = 55.7%)
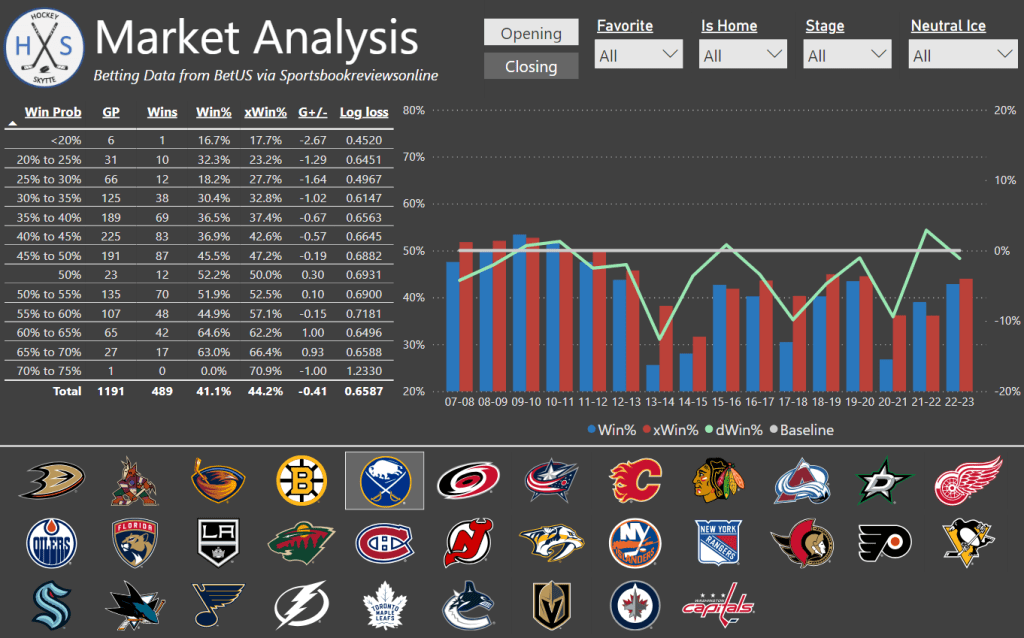
Buffalo Sabres (Win% = 41.1% vs. xWin% = 44.6%)
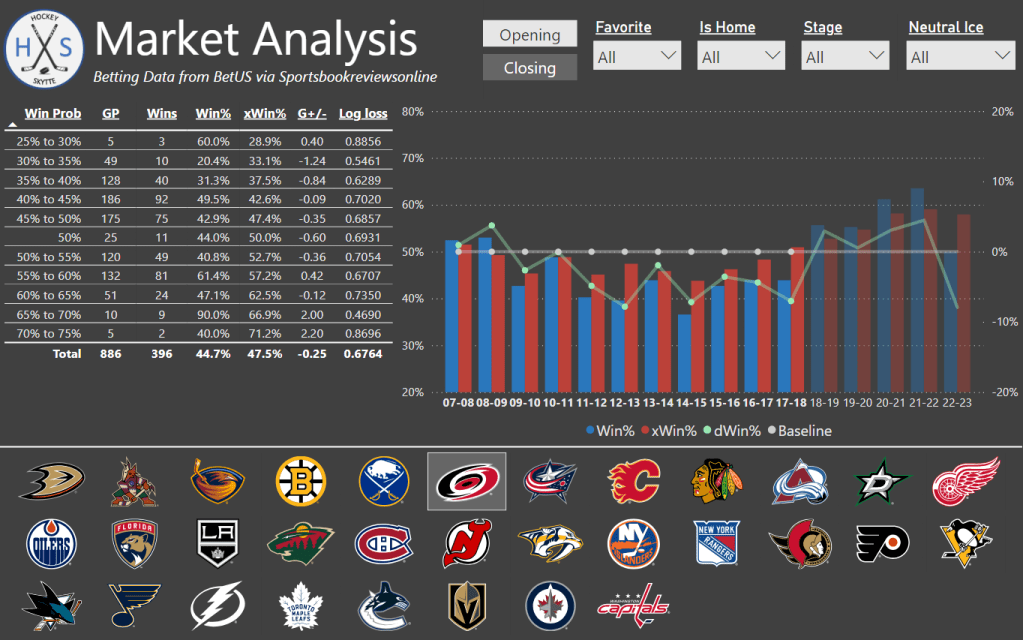
Carolina Hurricanes before they got it together (Win% = 44.7% vs. xWin% = 47.5%)
Of course there are exceptions to this, but it’s generally a good rule of thumb.
Conclusions
- It’s really difficult to consistently beat the closing lines. They are very well calibrated.
- If you see an edge on a favorite it’s probably a good idea to bet early – The market usually moves toward the favorite.
- It’s generally a good idea to bet on historically good teams and bet against historically bad teams. Over time it will be a good approach.
Betting markets aren’t necessarily aiming to be as correct as possible. A perfect betting line from the perspective of the bookmaker is one where they win money no matter the result.
