The following article is part of the NHL Guide 2023/2024. If you want access to the full guide (including Visualizations) or you just want to support my continued work, you should subscribe for just 10$ annually.
Model Description
3-year weighted data:
The season projections are based on performances from the previous 3 seasons. Last season is given half the weight, 2 years ago get one third of the weight and 3 years ago only get one sixth of the weight.
If a player only played in the previous season, then year 2 and 3 is just set to 0… But the data from last season is still only given half weight. This means that the model is designed to regress towards the average if the sample size is limited.
Calculating delta values:
The model is comparing the performance against the league average and then using that input to project future performance… So, instead of using raw data, I’m using delta values which calculate the impact compared to a league average player at the same position.
E.g., delta Even strength individual goals:

The variables:
Similarly to the calculation above, delta values are calculated for the last 3 seasons for the following metrics:

It’s worth noting that penalty differentials aren’t part of the season projections. Also, on the powerplay the players are judged on the results (G+/-), but on the penalty kill players are judged by chances given up (xG+/-).
These are the variables that are put into the model. The variables are then weighted based on recency and importance. As an example, secondary assists are worth much less than primary points.
Player Projections:
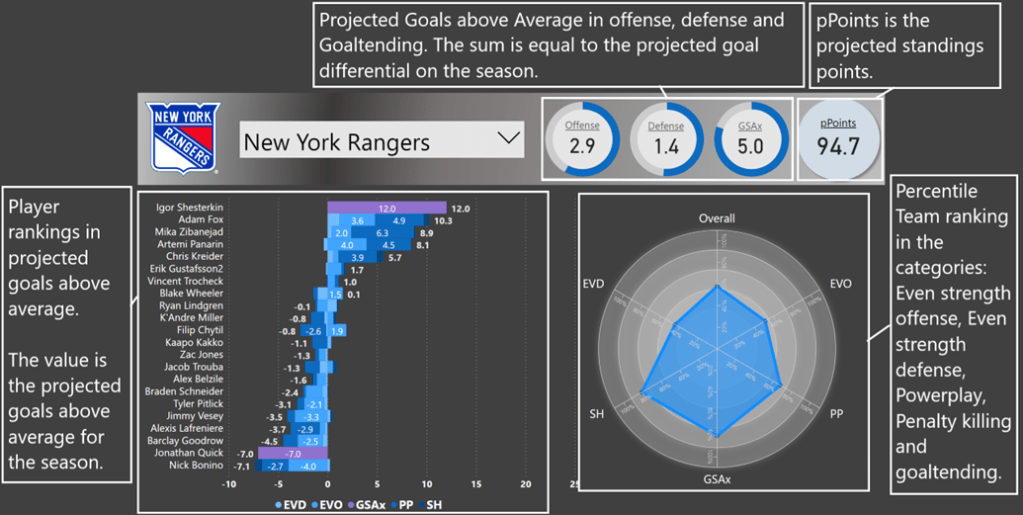
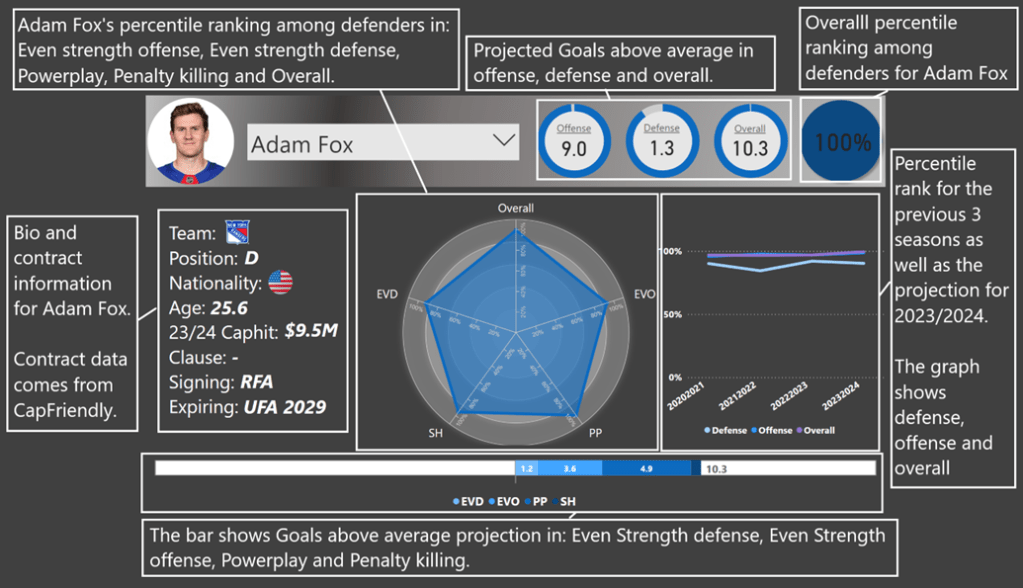
The player projections can now be calculated based on the weighted delta values and the age of the player – An ageing curve is applied. The model is designed to project Goals above average (GAA) for the season.
Team Projections:
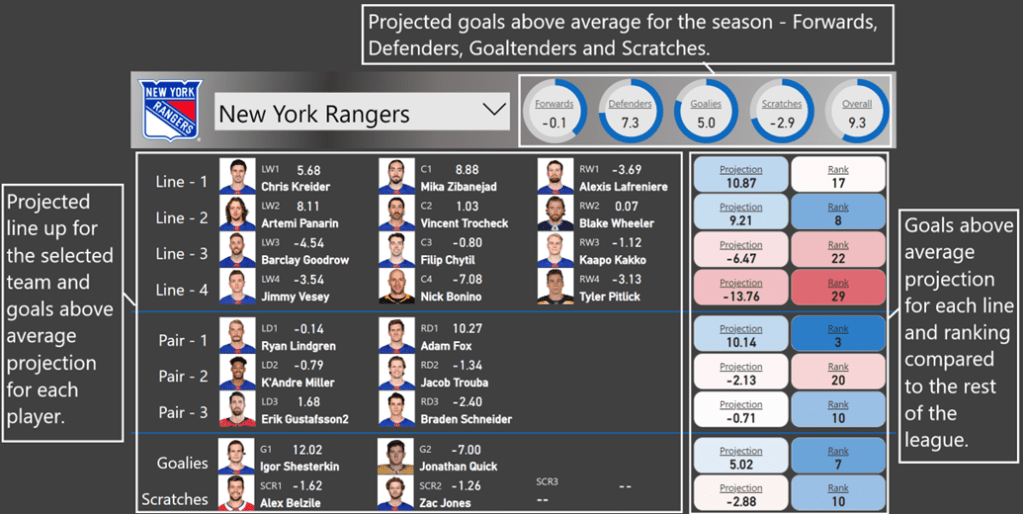
The team projections are simply calculated as the sum of all the player projections – Scratches are included in the season projections. Since the projections are in goals above average, then the team projections are equal to the projected goal differential.
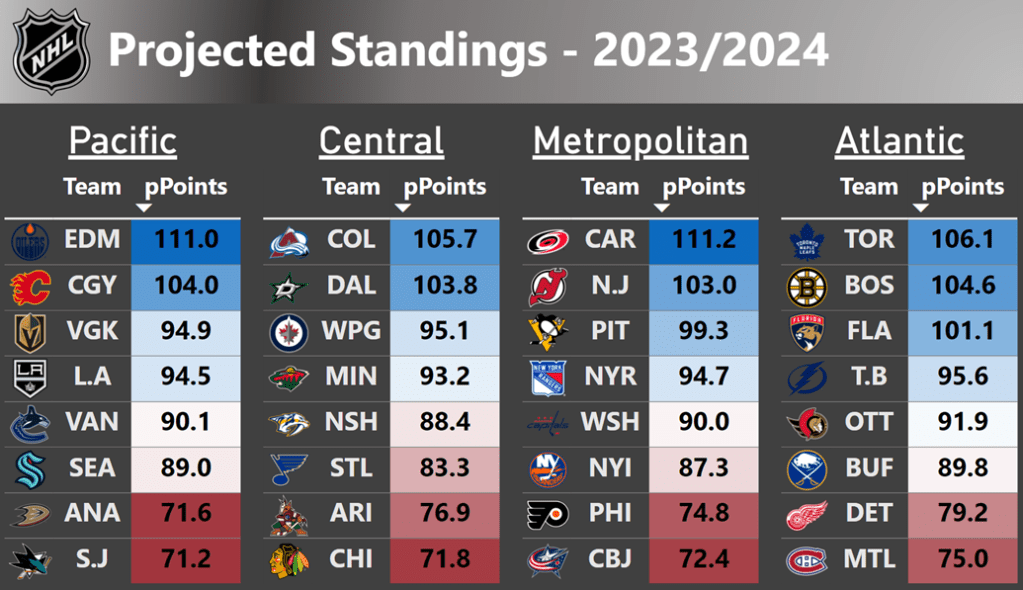
Win probabilities and projected Standings Points:
The projected standings points could be found from the team projection, but then the strength of schedule wouldn’t be included.
Instead, we can use the team projections to calculate a team strength, which can then be used to calculate the win probability for each game. This way we can include rest and strength of opponents in the projections.


For each game a rest factor and home/away factor is applied to the strength calculation.
Now the win probability can be calculated using the Log5 formula:

Now the projected points (pPoints) can be found:

The average number of standings points per game is 2.226 because some games are worth 3 points while other games are worth 2 points.
Rookies:
Rookies with no NHL data have a predefined value:

Obviously, some rookies (think Connor Bedard) will outperform this projection. I don’t want to project players with no NHL data, but you will need to be aware of this in your interpretation of the model.
Game Projection Model:
All projections below are season projections. How well is a team or player projected to perform in the upcoming season? However, during the season I will have Game Projections for each game, and these projections will be based on the Season Projections (Pre_Season Model) and performance within the season (In_Season Model).
As the season progresses more and more weight will be put on the In_Season results. You can view the Season Projections as the starting point for every player/team. So, the projections for each game is a combination of the Pre_Season model and the In_Season Model:

For a player’s first game of the season 100% of the projection comes from the Season Projections, but that gradually decreases to 25% after 50 games. Then it remains 25% for the remainder of the season:

In other words, for the first game of the season 100% of the projection comes from the Season Projections and 0% comes from the results within the season. After 50 games 25% of the projection comes from the Season Projections and 75% comes from the results within the season.
Model Interpretation
Before you start interpreting the projections below, there’s a few important things to be aware of.
Productivity is not the same as Potential:
In a team sport like Hockey, the best team isn’t always equal to the team with the best players. Other factors also play a role. In team sports we say that:

Productivity is the team performance/results, Potential is the sum of the individual players and the Processes is everything else – How well are the players working together? Sometimes a team performs better than the sum of its parts.
The processes could be things like strategy/tactics, Line Chemistry, Ice time allocation and Communication. Are the players being used in an optimal way?
Understanding this is important, because the model is trying to estimate the productivity (impact) and not the potential (talent). If a player switches teams or he is given a different role (e.g., PP time), then his productivity is likely to change.
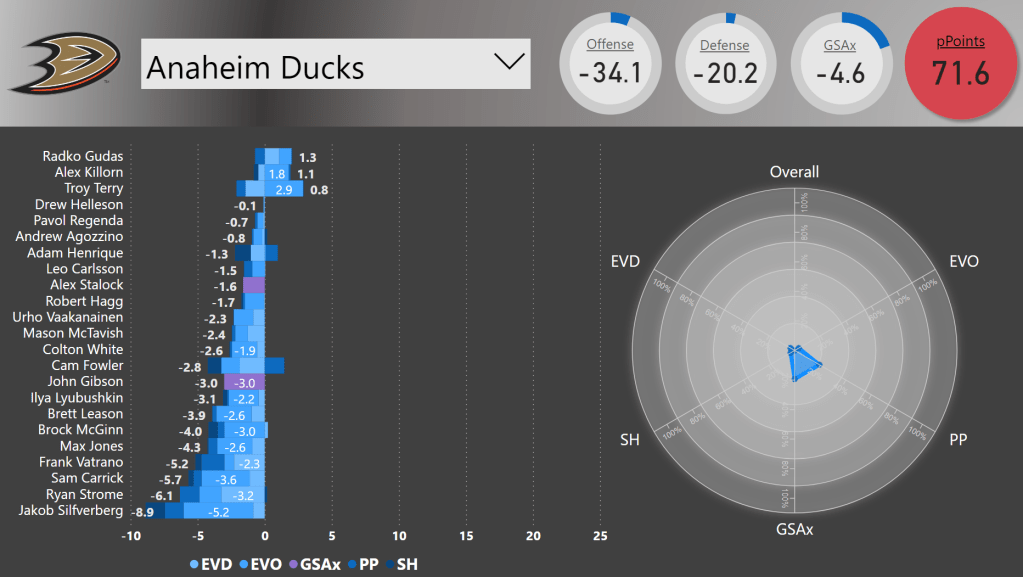
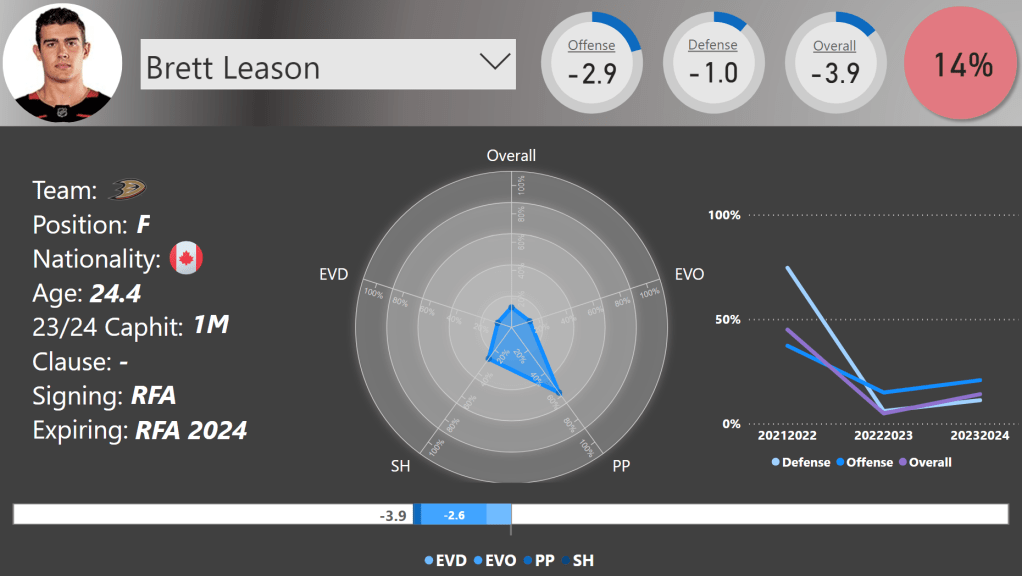
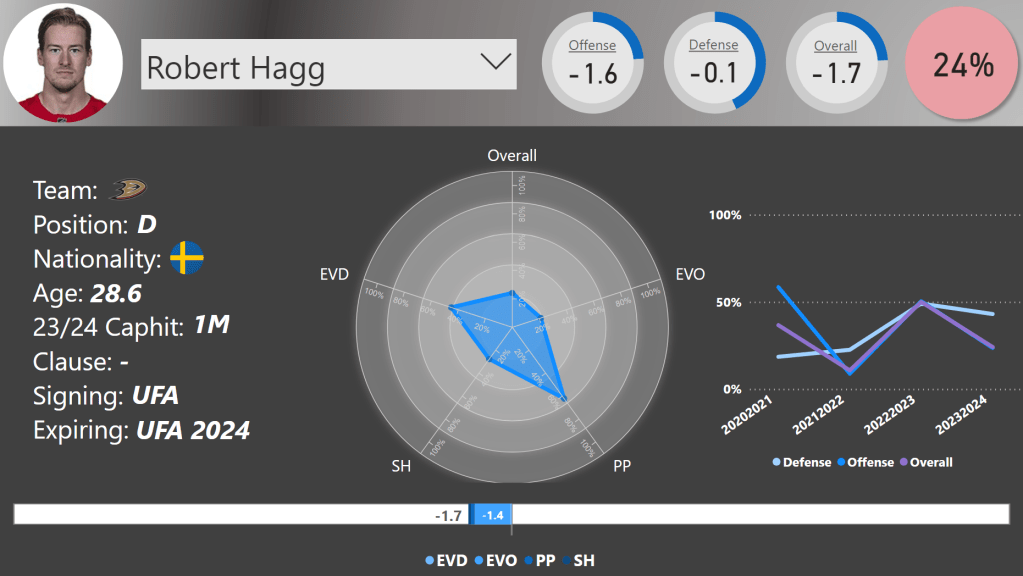
Some teams performed really bad last season (e.g., ANA), so most players in that setting probably performed worse than their potential… And it shows in the projections. If those players switch teams or the team can improve the processes, then they are likely to outperform their projection.
The opposite is of course the case for teams with a productivity higher than their potential (e.g., BOS). In that case, the projections could be slightly inflated.
Rookies:
Like I mentioned above, all rookies have the same projection. So, if you believe Connor Bedard will be a difference-maker right of the bat, then you will have to include that in your interpretation of the projections.
Model based on Totals and not Rates:
The projections are based on total impact of the previous 3 seasons. So, if the sample size is limited, then the projection will be conservative (revert towards the average). If a player has been injured (think Mark Stone), then it will be reflected in the projection. If you believe Mark Stone will be wholly healthy next season, then his projection is way too low.
This is isn’t such a big problem in the Game Projections, because In-Season data will quickly be applied.
Goaltenders:
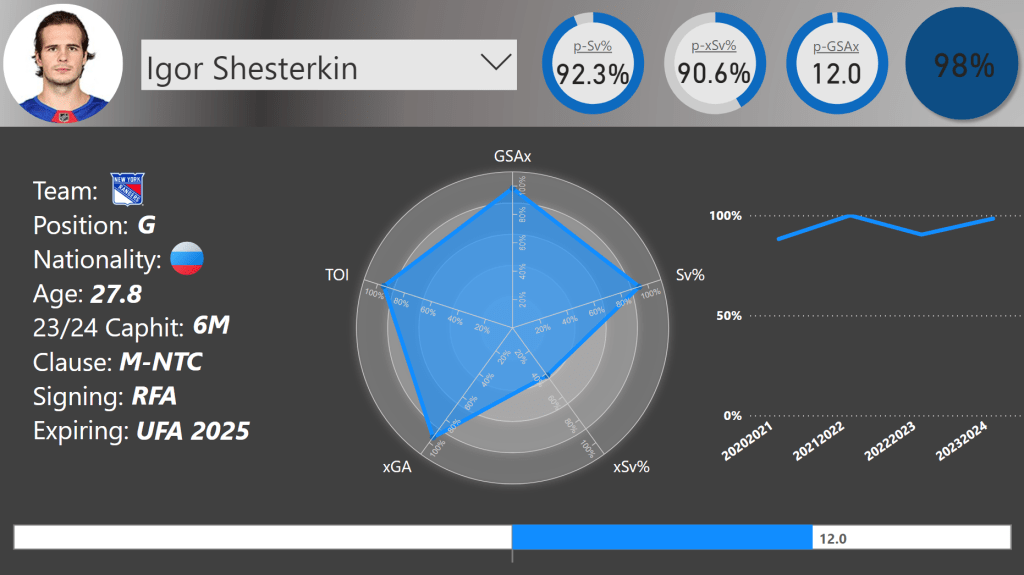
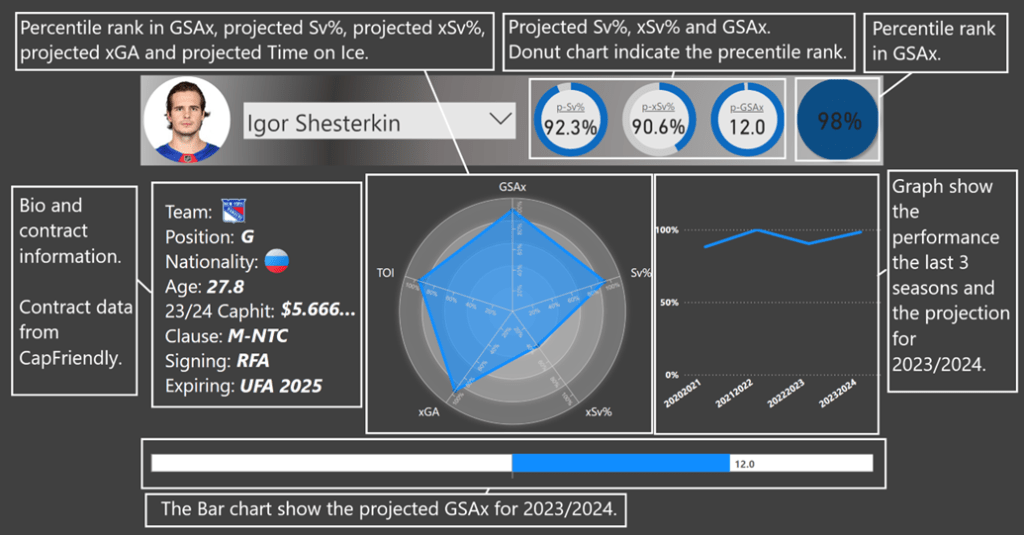
It’s nearly impossible to predict year-over-year goaltender performance. This variance means that the season projections for goaltenders will have to quite conservative… So, if you believe a goaltender like Sorokin or Shesterkin will be a top goaltender again this year, then they are likely to outperform their projections.
The good thing is that goaltending is fairly predictable within the season, so the Game Projection model will quickly adjust if a goaltender is indeed better (or worse) than his season projection. Much more weight is put on In-Season performance.
Lineups:
Lineups are taken from CapFriendly and doesn’t include injured players (e.g., Vasilevskiy, Ekblad). You will have to account for this in your interpretation of the projections.
Only regular season is included:
The last thing to be aware of is that the projections are based solely on regular season performance. This makes sense because we’re trying to predict regular season performance. However, someone like Igor Shesterkin has been outright dominant in the playoffs for two years straight, and you could make an argument that this information should also be part of the projection.
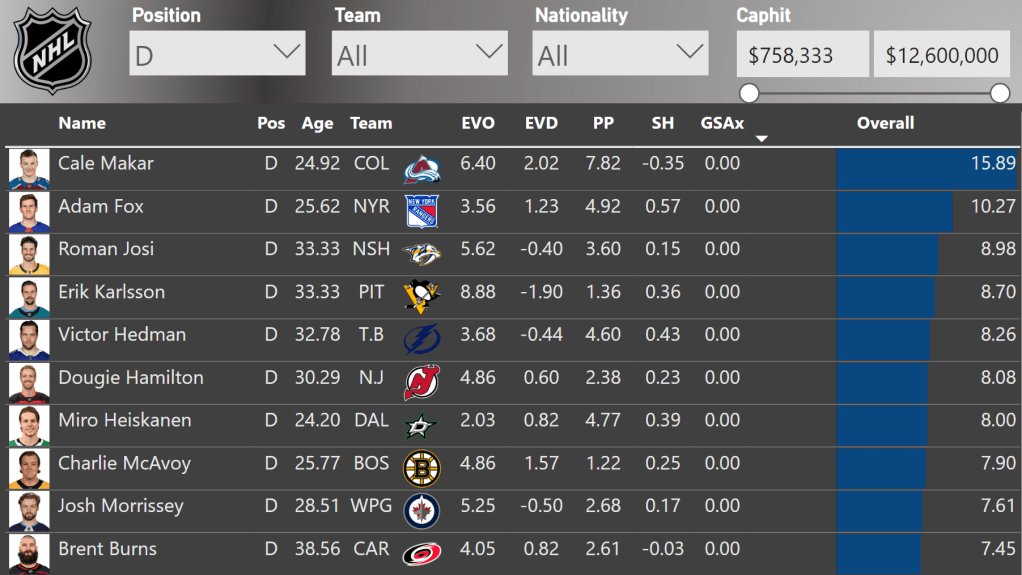
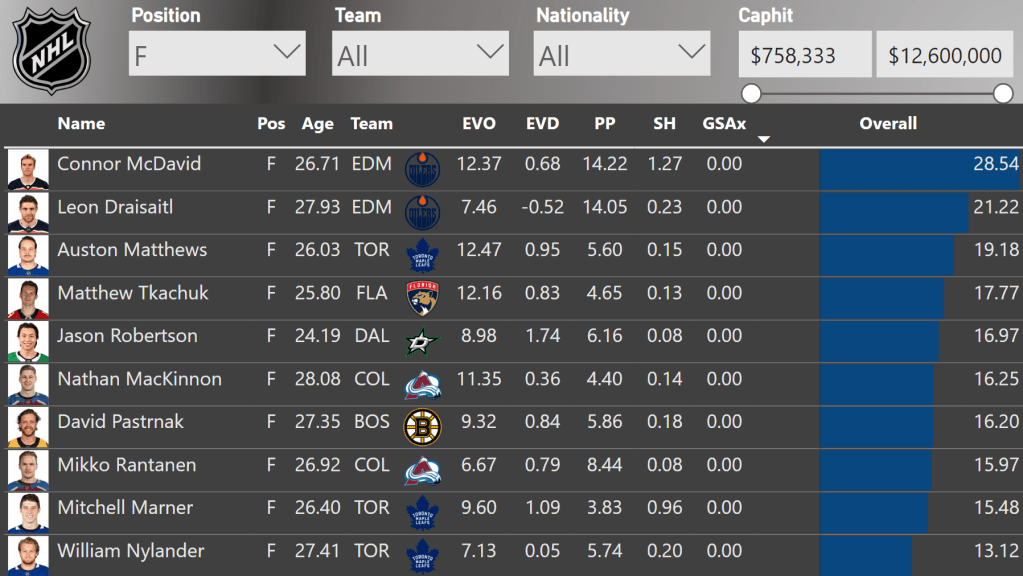
Top 10 Rankings

Explainers
Standings Projections
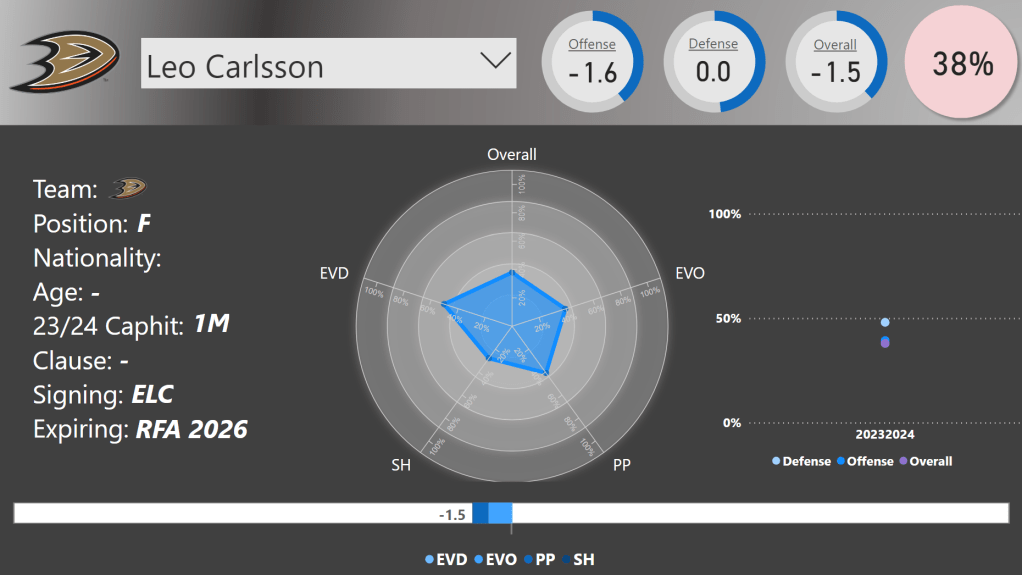
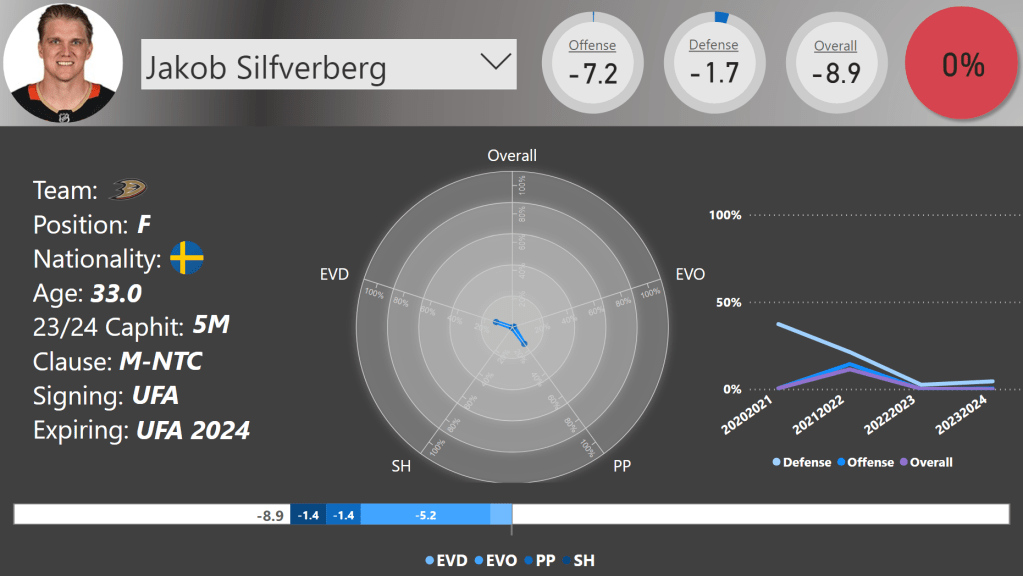
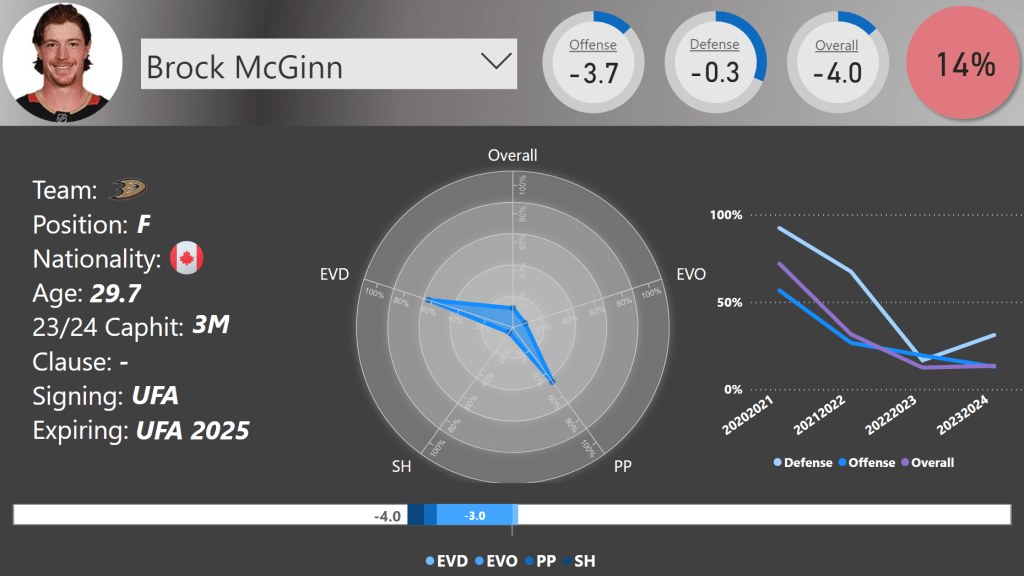
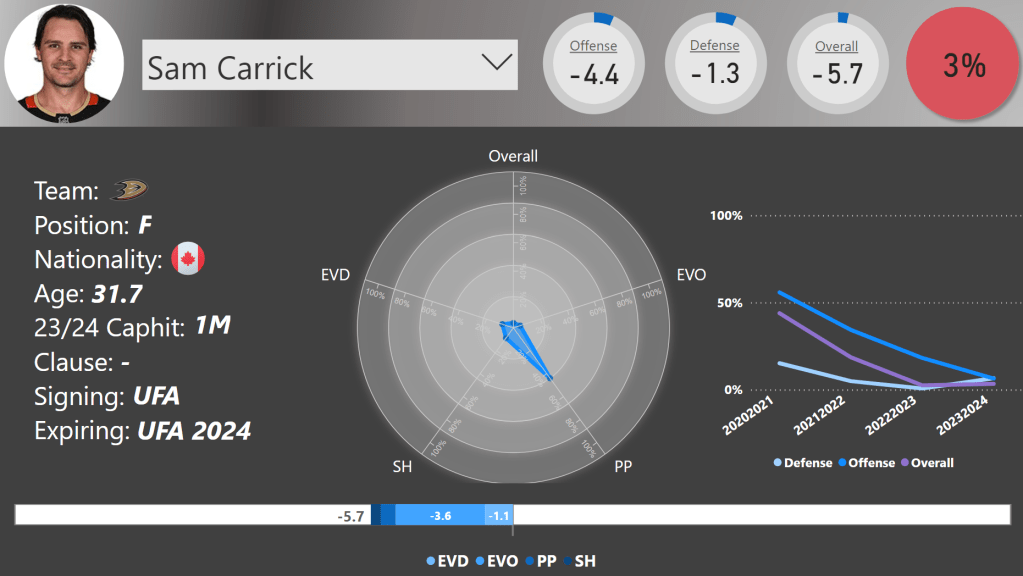
Preview: Anaheim Ducks
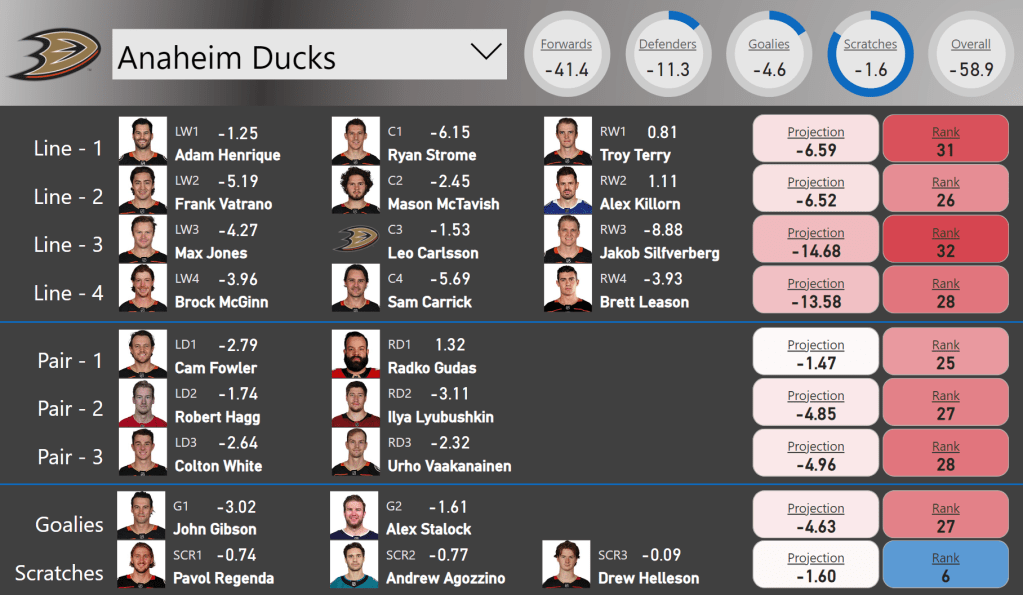
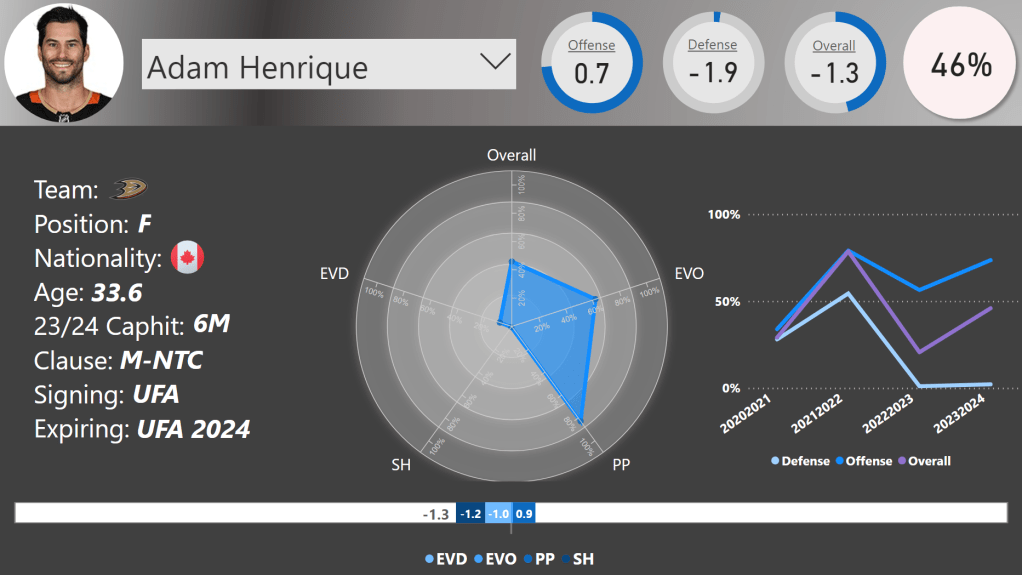
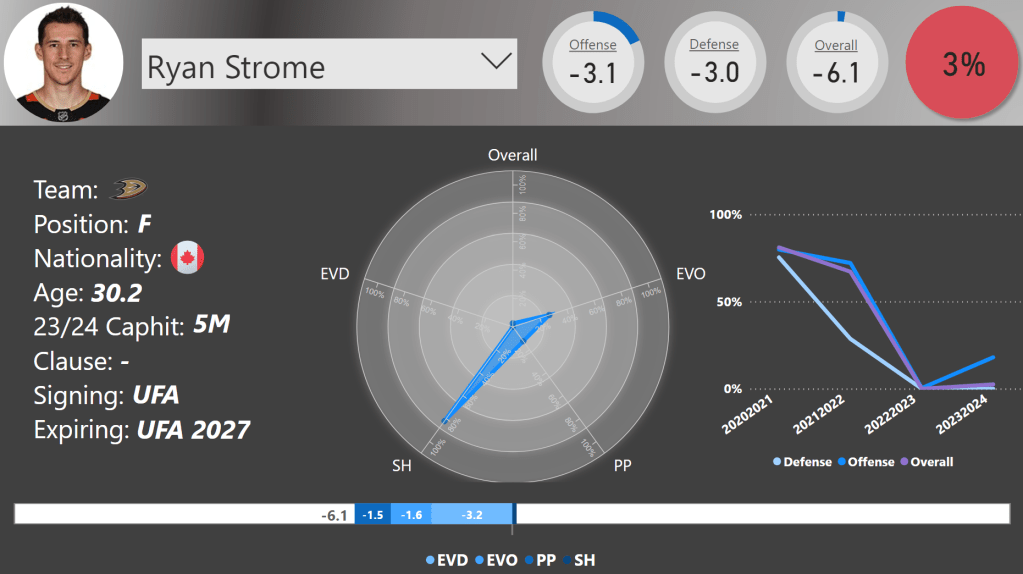
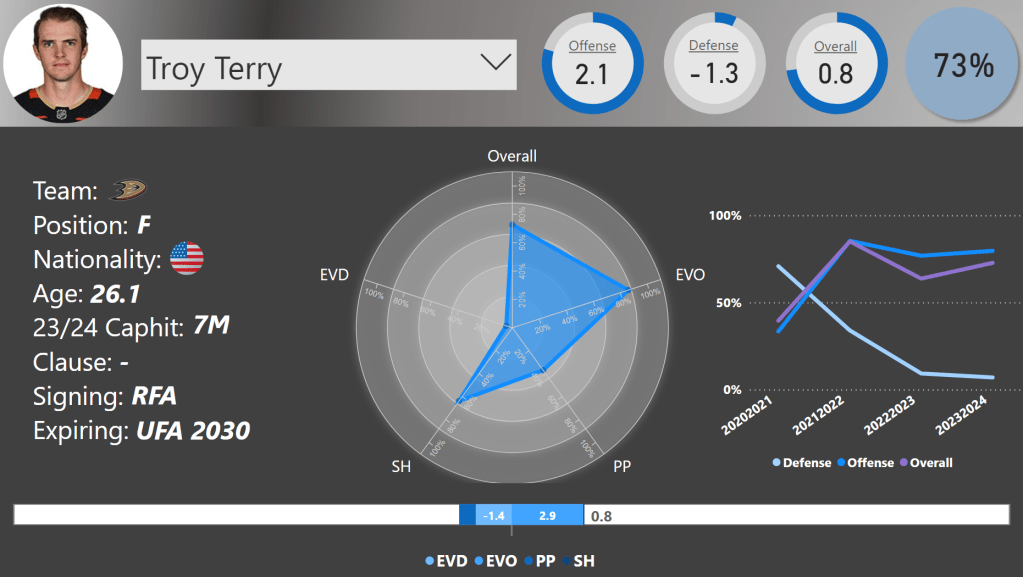
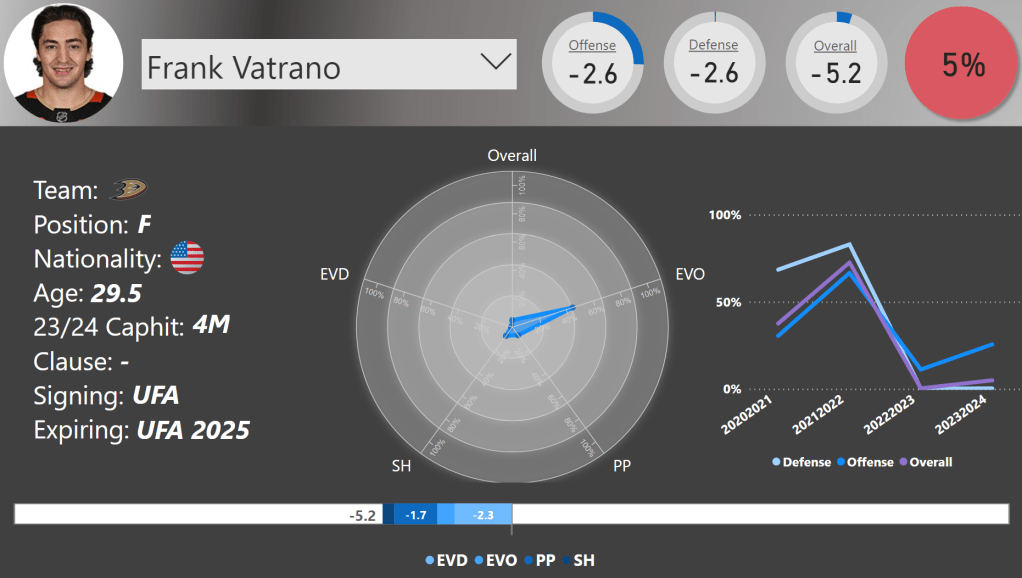
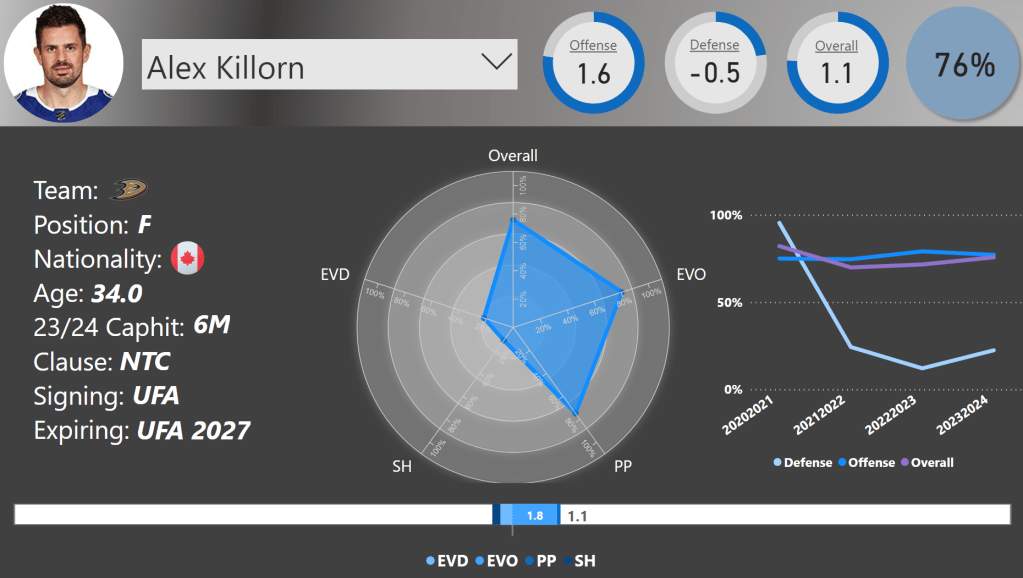
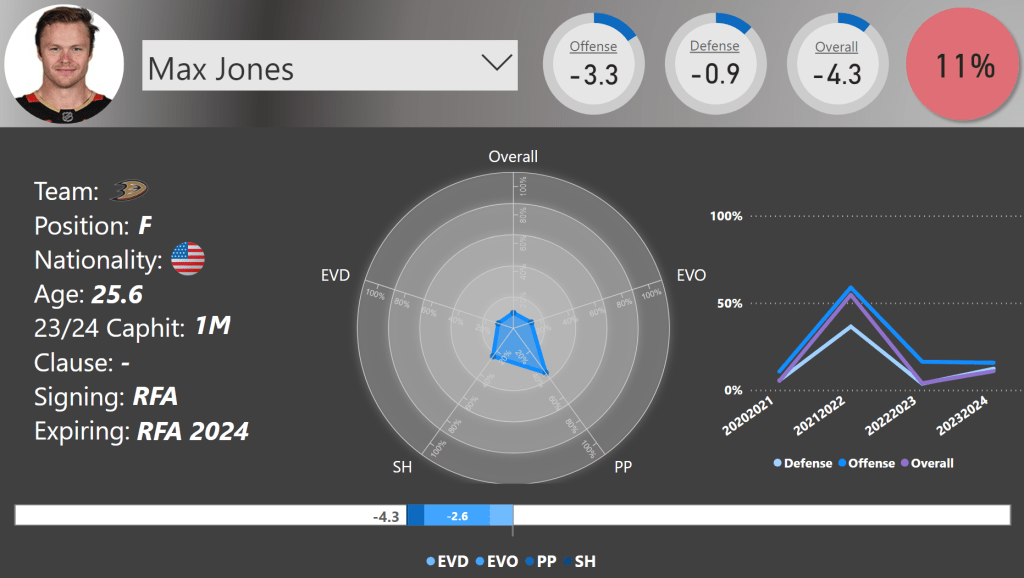
1st Line
2nd Line

3rd Line
4th Line
1st Pair


2nd Pair

3rd Pair


Goaltenders


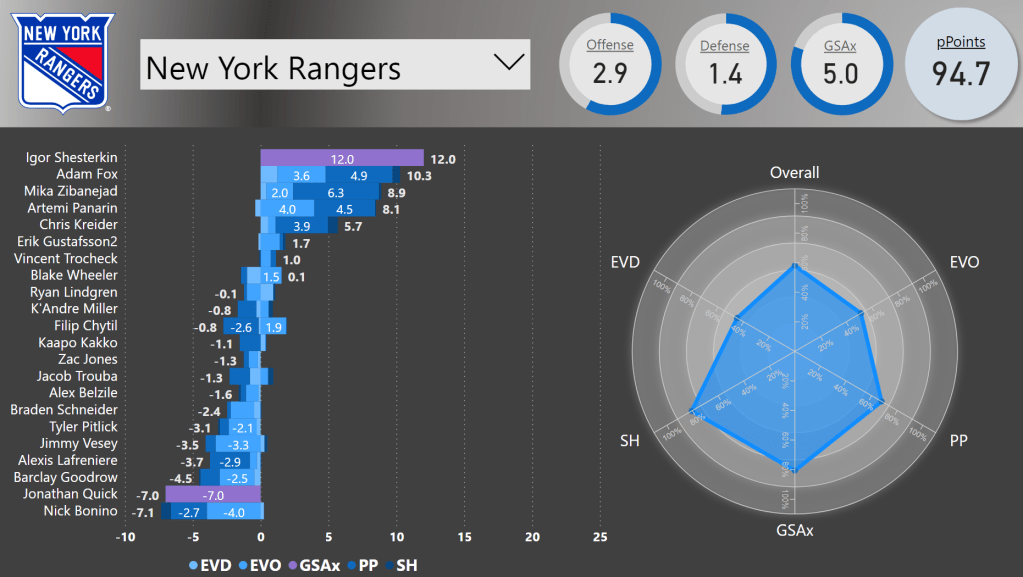
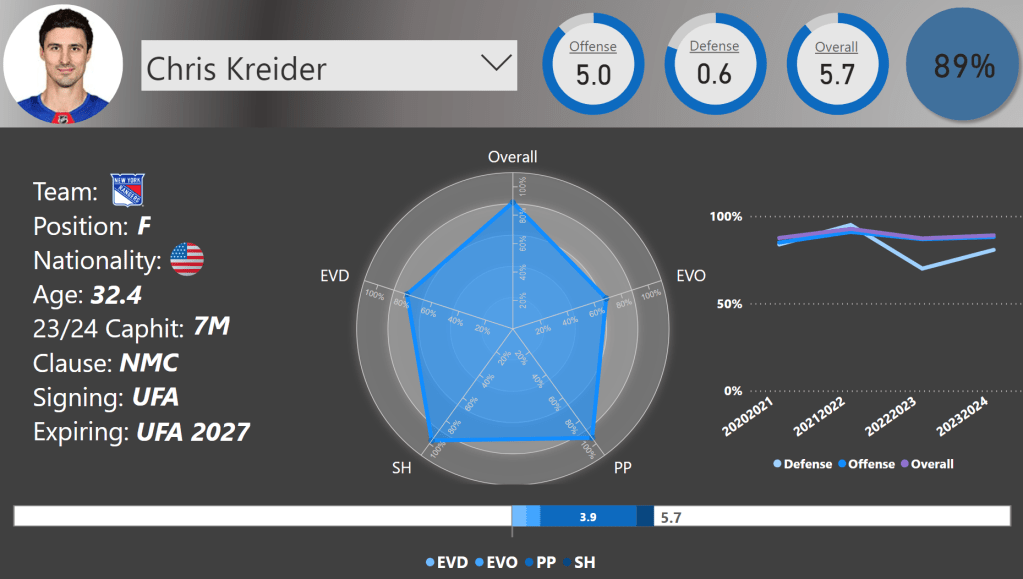
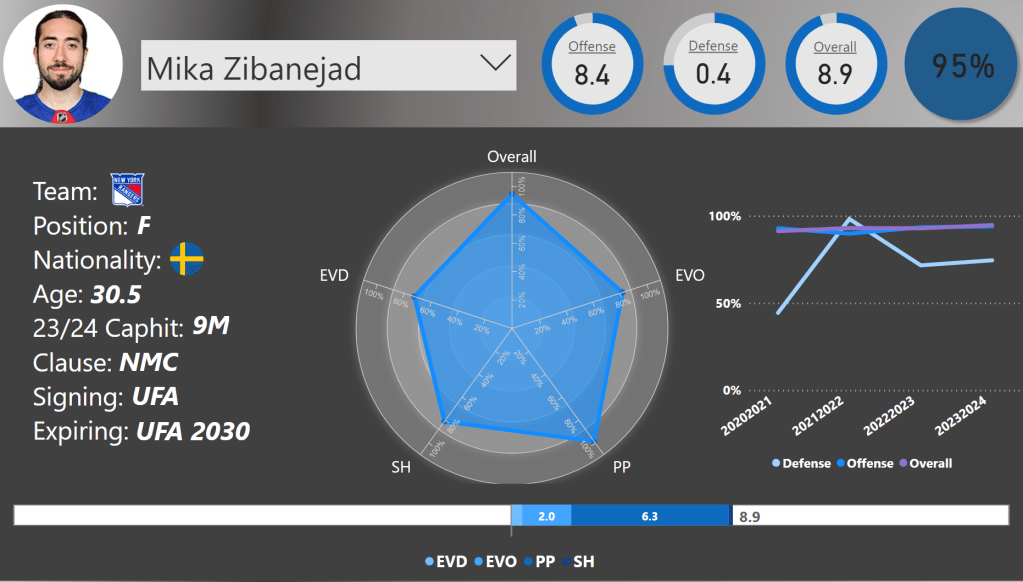
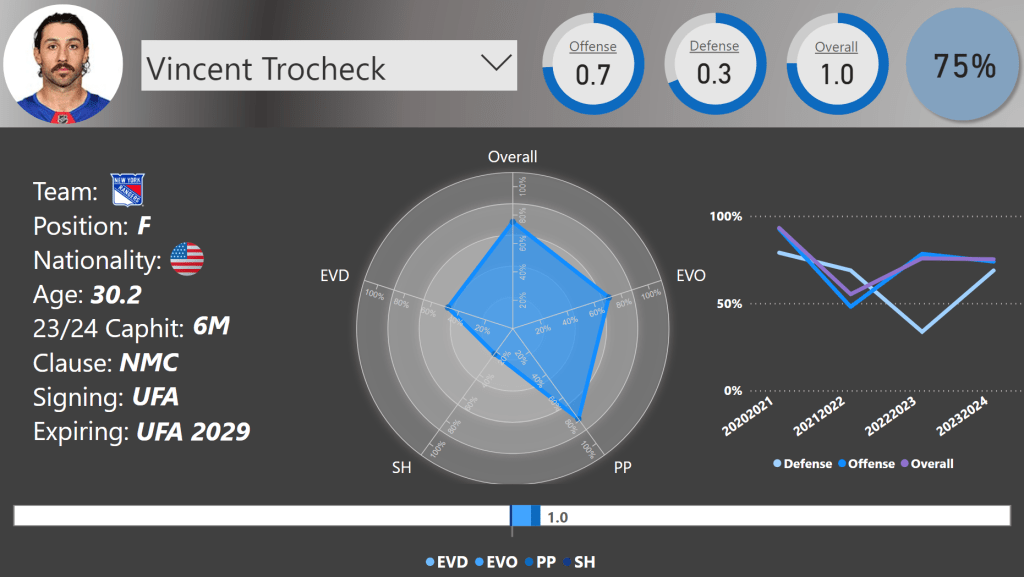
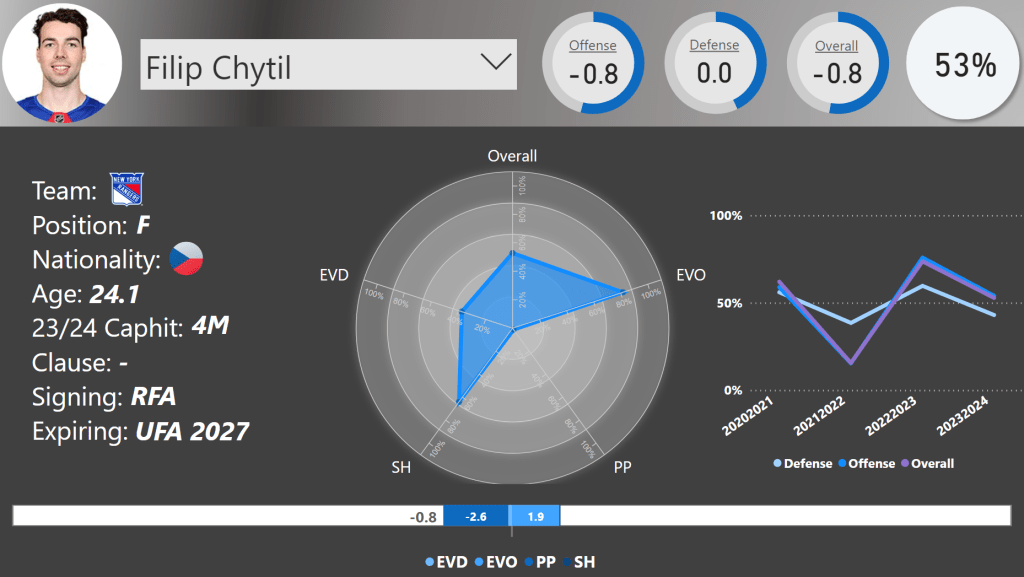
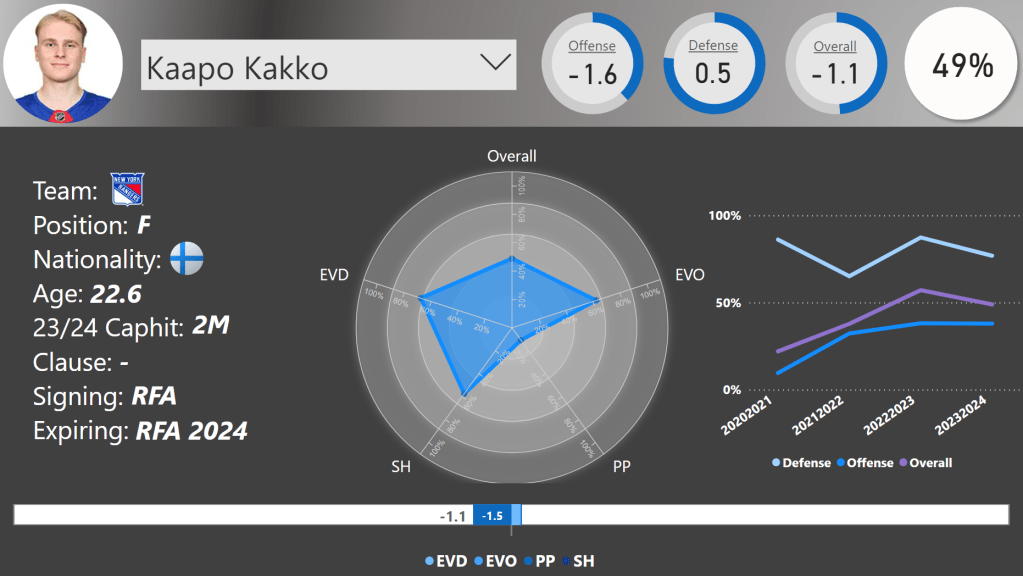
Preview: New York Rangers

1st Line

2nd Line


3rd Line

4th Line

1st Pair

2nd Pair

3rd Pair


Goaltenders